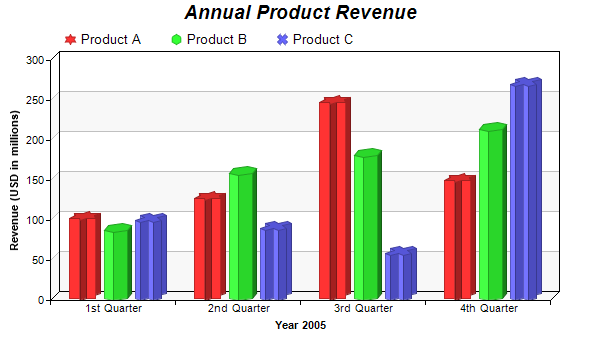
This example demonstrates a multi-bar chart in which each data set has a different bar shape.
The bar shapes are specified using BarLayer.setBarShape. See Shape Specification on how built-in and custom shapes are defined in ChartDirector.
ChartDirector 6.0 (Ruby Edition)
Multi-Shape Bar Chart
Source Code Listing
require("chartdirector")

class MultishapebarController < ApplicationController

    def index()
        @title = "Multi-Shape Bar Chart"
        @ctrl_file = File.expand_path(__FILE__)
        @noOfCharts = 1
        render :template => "templates/chartview"
    end

    #
    # Render and deliver the chart
    #
    def getchart()
        # The data for the bar chart
        data0 = [100, 125, 245, 147]
        data1 = [85, 156, 179, 211]
        data2 = [97, 87, 56, 267]
        labels = ["1st Quarter", "2nd Quarter", "3rd Quarter", "4th Quarter"]

        # Create a XYChart object of size 600 x 350 pixels
        c = ChartDirector::XYChart.new(600, 350)

        # Add a title to the chart using 14pt Arial Bold Italic font
        c.addTitle("Annual Product Revenue", "arialbi.ttf", 14)

        # Set the plot area at (50, 60) and of size 500 x 240. Use two alternative background colors
        # (f8f8f8 and ffffff)
        c.setPlotArea(50, 60, 500, 240, 0xf8f8f8, 0xffffff)

        # Add a legend box at (55, 22) using horizontal layout, with transparent background
        c.addLegend(55, 22, false).setBackground(ChartDirector::Transparent)

        # Set the x axis labels
        c.xAxis().setLabels(labels)

        # Draw the ticks between label positions (instead of at label positions)
        c.xAxis().setTickOffset(0.5)

        # Add a multi-bar layer with 3 data sets and 9 pixels 3D depth
        layer = c.addBarLayer2(ChartDirector::Side, 9)
        layer.addDataSet(data0, -1, "Product A")
        layer.addDataSet(data1, -1, "Product B")
        layer.addDataSet(data2, -1, "Product C")

        # Set data set 1 to use a bar shape of a 6-pointed star
        layer.setBarShape(ChartDirector::StarShape(6), 0)

        # Set data set 2 to use a bar shapre of a 6-sided polygon
        layer.setBarShape(ChartDirector::PolygonShape(6), 1)

        # Set data set 3 to use an X bar shape
        layer.setBarShape(ChartDirector::Cross2Shape(), 2)

        # Add a title to the y-axis
        c.yAxis().setTitle("Revenue (USD in millions)")

        # Add a title to the x axis
        c.xAxis().setTitle("Year 2005")

        # Output the chart
        send_data(c.makeChart2(ChartDirector::PNG), :type => "image/png", :disposition => "inline")

    end

end |
<html>
<body style="margin:5px 0px 0px 5px">

<!-- Title -->
<div style="font-size:18pt; font-family:verdana; font-weight:bold">
    <%= @title %>
</div>
<hr style="border:solid 1px #000080" />

<!-- Source Code Listing Link -->
<div style="font-size:9pt; font-family:verdana; margin-bottom:1.5em">
    <%= link_to "Source Code Listing",
        :controller => "cddemo", :action => "viewsource",
        :ctrl_file => @ctrl_file, :view_file => File.expand_path(__FILE__) %>
</div>

<!-- Create one or more IMG tags to display the demo chart(s) -->
<% 0.upto(@noOfCharts - 1) do |i| %>
    <img src="<%= url_for(:action => "getchart", :img => i) %>">
<% end %>

</body>
</html> |
#!/usr/bin/env ruby
require("chartdirector")

# The data for the bar chart
data0 = [100, 125, 245, 147]
data1 = [85, 156, 179, 211]
data2 = [97, 87, 56, 267]
labels = ["1st Quarter", "2nd Quarter", "3rd Quarter", "4th Quarter"]

# Create a XYChart object of size 600 x 350 pixels
c = ChartDirector::XYChart.new(600, 350)

# Add a title to the chart using 14pt Arial Bold Italic font
c.addTitle("Annual Product Revenue", "arialbi.ttf", 14)

# Set the plot area at (50, 60) and of size 500 x 240. Use two alternative background colors (f8f8f8
# and ffffff)
c.setPlotArea(50, 60, 500, 240, 0xf8f8f8, 0xffffff)

# Add a legend box at (55, 22) using horizontal layout, with transparent background
c.addLegend(55, 22, false).setBackground(ChartDirector::Transparent)

# Set the x axis labels
c.xAxis().setLabels(labels)

# Draw the ticks between label positions (instead of at label positions)
c.xAxis().setTickOffset(0.5)

# Add a multi-bar layer with 3 data sets and 9 pixels 3D depth
layer = c.addBarLayer2(ChartDirector::Side, 9)
layer.addDataSet(data0, -1, "Product A")
layer.addDataSet(data1, -1, "Product B")
layer.addDataSet(data2, -1, "Product C")

# Set data set 1 to use a bar shape of a 6-pointed star
layer.setBarShape(ChartDirector::StarShape(6), 0)

# Set data set 2 to use a bar shapre of a 6-sided polygon
layer.setBarShape(ChartDirector::PolygonShape(6), 1)

# Set data set 3 to use an X bar shape
layer.setBarShape(ChartDirector::Cross2Shape(), 2)

# Add a title to the y-axis
c.yAxis().setTitle("Revenue (USD in millions)")

# Add a title to the x axis
c.xAxis().setTitle("Year 2005")

# Output the chart
c.makeChart("multishapebar.png") |