require("chartdirector")
class PolarbubbleController < ApplicationController
def index()
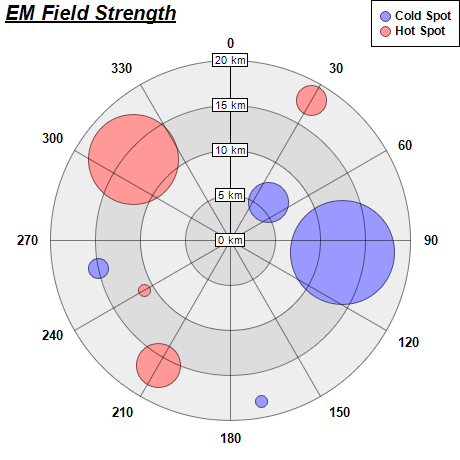
@title = "Polar Bubble Chart"
@ctrl_file = File.expand_path(__FILE__)
@noOfCharts = 1
render :template => "templates/chartview"
end
#
# Render and deliver the chart
#
def getchart()
# The data for the chart
data0 = [6, 12.5, 18.2, 15]
angles0 = [45, 96, 169, 258]
size0 = [41, 105, 12, 20]
data1 = [18, 16, 11, 14]
angles1 = [30, 210, 240, 310]
size1 = [30, 45, 12, 90]
# Create a PolarChart object of size 460 x 460 pixels
c = ChartDirector::PolarChart.new(460, 460)
# Add a title to the chart at the top left corner using 15pt Arial Bold Italic font
c.addTitle2(ChartDirector::TopLeft, "<*underline=2*>EM Field Strength", "arialbi.ttf", 15)
# Set center of plot area at (230, 240) with radius 180 pixels
c.setPlotArea(230, 240, 180)
# Use alternative light grey/dark grey circular background color
c.setPlotAreaBg(0xdddddd, 0xeeeeee)
# Set the grid style to circular grid
c.setGridStyle(false)
# Add a legend box at the top right corner of the chart using 9pt Arial Bold font
c.addLegend(459, 0, true, "arialbd.ttf", 9).setAlignment(ChartDirector::TopRight)
# Set angular axis as 0 - 360, with a spoke every 30 units
c.angularAxis().setLinearScale(0, 360, 30)
# Set the radial axis label format
c.radialAxis().setLabelFormat("{value} km")
# Add a blue (0x9999ff) line layer to the chart using (data0, angle0)
layer0 = c.addLineLayer(data0, 0x9999ff, "Cold Spot")
layer0.setAngles(angles0)
# Disable the line by setting its width to 0, so only the symbols are visible
layer0.setLineWidth(0)
# Use a circular data point symbol
layer0.setDataSymbol(ChartDirector::CircleSymbol, 11)
# Modulate the symbol size by size0 to produce a bubble chart effect
layer0.setSymbolScale(size0)
# Add a red (0xff9999) line layer to the chart using (data1, angle1)
layer1 = c.addLineLayer(data1, 0xff9999, "Hot Spot")
layer1.setAngles(angles1)
# Disable the line by setting its width to 0, so only the symbols are visible
layer1.setLineWidth(0)
# Use a circular data point symbol
layer1.setDataSymbol(ChartDirector::CircleSymbol, 11)
# Modulate the symbol size by size1 to produce a bubble chart effect
layer1.setSymbolScale(size1)
# Output the chart
send_data(c.makeChart2(ChartDirector::PNG), :type => "image/png", :disposition => "inline")
end
end |