ChartDirector 6.0 (Ruby Edition)

Polar Line Chart


This example demonstrates a polar line chart, completed with data symbols and data labels.

Source Code Listing

[Ruby On Rails Version - Controller] app/controllers/polarline_controller.rb
require("chartdirector")

class PolarlineController < ApplicationController

    def index()
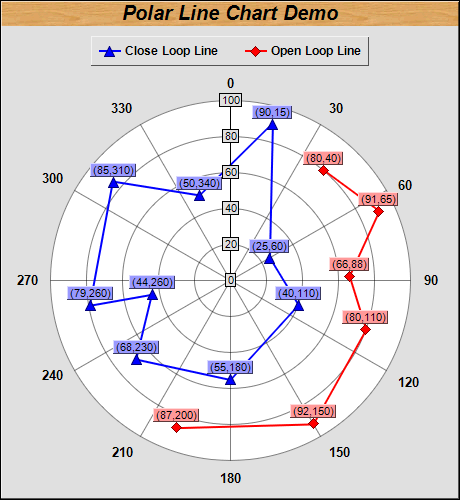
        @title = "Polar Line Chart"
        @ctrl_file = File.expand_path(__FILE__)
        @noOfCharts = 1
        render :template => "templates/chartview"
    end

    #
    # Render and deliver the chart
    #
    def getchart()
        # The data for the chart
        data0 = [90, 25, 40, 55, 68, 44, 79, 85, 50]
        angles0 = [15, 60, 110, 180, 230, 260, 260, 310, 340]

        data1 = [80, 91, 66, 80, 92, 87]
        angles1 = [40, 65, 88, 110, 150, 200]

        # Create a PolarChart object of size 460 x 500 pixels, with a grey (e0e0e0) background and 1
        # pixel 3D border
        c = ChartDirector::PolarChart.new(460, 500, 0xe0e0e0, 0x000000, 1)

        # Add a title to the chart at the top left corner using 15pt Arial Bold Italic font. Use a
        # wood pattern as the title background.
        c.addTitle("Polar Line Chart Demo", "arialbi.ttf", 15).setBackground(c.patternColor(
            File.dirname(__FILE__) + "/wood.png"))

        # Set center of plot area at (230, 280) with radius 180 pixels, and white (ffffff)
        # background.
        c.setPlotArea(230, 280, 180, 0xffffff)

        # Set the grid style to circular grid, with grids below the chart layers
        c.setGridStyle(false, false)

        # Add a legend box at top-center of plot area (230, 35) using horizontal layout. Use 10pt
        # Arial Bold font, with 1 pixel 3D border effect.
        b = c.addLegend(230, 35, false, "arialbd.ttf", 9)
        b.setAlignment(ChartDirector::TopCenter)
        b.setBackground(ChartDirector::Transparent, ChartDirector::Transparent, 1)

        # Set angular axis as 0 - 360, with a spoke every 30 units
        c.angularAxis().setLinearScale(0, 360, 30)

        # Add a blue (0xff) line layer to the chart using (data0, angle0)
        layer0 = c.addLineLayer(data0, 0x0000ff, "Close Loop Line")
        layer0.setAngles(angles0)

        # Set the line width to 2 pixels
        layer0.setLineWidth(2)

        # Use 11 pixel triangle symbols for the data points
        layer0.setDataSymbol(ChartDirector::TriangleSymbol, 11)

        # Enable data label and set its format
        layer0.setDataLabelFormat("({value},{angle})")

        # Set the data label text box with light blue (0x9999ff) backgruond color and 1 pixel 3D
        # border effect
        layer0.setDataLabelStyle().setBackground(0x9999ff, ChartDirector::Transparent, 1)

        # Add a red (0xff0000) line layer to the chart using (data1, angle1)
        layer1 = c.addLineLayer(data1, 0xff0000, "Open Loop Line")
        layer1.setAngles(angles1)

        # Set the line width to 2 pixels
        layer1.setLineWidth(2)

        # Use 11 pixel diamond symbols for the data points
        layer1.setDataSymbol(ChartDirector::DiamondSymbol, 11)

        # Set the line to open loop
        layer1.setCloseLoop(false)

        # Enable data label and set its format
        layer1.setDataLabelFormat("({value},{angle})")

        # Set the data label text box with light red (0xff9999) backgruond color and 1 pixel 3D
        # border effect
        layer1.setDataLabelStyle().setBackground(0xff9999, ChartDirector::Transparent, 1)

        # Output the chart
        send_data(c.makeChart2(ChartDirector::PNG), :type => "image/png", :disposition => "inline")

    end

end

[Ruby On Rails Version - View] app/views/templates/chartview.html.erb
<html>
<body style="margin:5px 0px 0px 5px">

<!-- Title -->
<div style="font-size:18pt; font-family:verdana; font-weight:bold">
    <%= @title %>
</div>
<hr style="border:solid 1px #000080" />

<!-- Source Code Listing Link -->
<div style="font-size:9pt; font-family:verdana; margin-bottom:1.5em">
    <%= link_to "Source Code Listing", 
        :controller => "cddemo", :action => "viewsource",
        :ctrl_file => @ctrl_file, :view_file => File.expand_path(__FILE__) %>
</div>

<!-- Create one or more IMG tags to display the demo chart(s) -->
<% 0.upto(@noOfCharts - 1) do |i| %>
    <img src="<%= url_for(:action => "getchart", :img => i) %>">
<% end %>

</body>
</html>

[Command Line Version] rubydemo/polarline.rb
#!/usr/bin/env ruby
require("chartdirector")

# The data for the chart
data0 = [90, 25, 40, 55, 68, 44, 79, 85, 50]
angles0 = [15, 60, 110, 180, 230, 260, 260, 310, 340]

data1 = [80, 91, 66, 80, 92, 87]
angles1 = [40, 65, 88, 110, 150, 200]

# Create a PolarChart object of size 460 x 500 pixels, with a grey (e0e0e0) background and 1 pixel
# 3D border
c = ChartDirector::PolarChart.new(460, 500, 0xe0e0e0, 0x000000, 1)

# Add a title to the chart at the top left corner using 15pt Arial Bold Italic font. Use a wood
# pattern as the title background.
c.addTitle("Polar Line Chart Demo", "arialbi.ttf", 15).setBackground(c.patternColor("wood.png"))

# Set center of plot area at (230, 280) with radius 180 pixels, and white (ffffff) background.
c.setPlotArea(230, 280, 180, 0xffffff)

# Set the grid style to circular grid, with grids below the chart layers
c.setGridStyle(false, false)

# Add a legend box at top-center of plot area (230, 35) using horizontal layout. Use 10pt Arial Bold
# font, with 1 pixel 3D border effect.
b = c.addLegend(230, 35, false, "arialbd.ttf", 9)
b.setAlignment(ChartDirector::TopCenter)
b.setBackground(ChartDirector::Transparent, ChartDirector::Transparent, 1)

# Set angular axis as 0 - 360, with a spoke every 30 units
c.angularAxis().setLinearScale(0, 360, 30)

# Add a blue (0xff) line layer to the chart using (data0, angle0)
layer0 = c.addLineLayer(data0, 0x0000ff, "Close Loop Line")
layer0.setAngles(angles0)

# Set the line width to 2 pixels
layer0.setLineWidth(2)

# Use 11 pixel triangle symbols for the data points
layer0.setDataSymbol(ChartDirector::TriangleSymbol, 11)

# Enable data label and set its format
layer0.setDataLabelFormat("({value},{angle})")

# Set the data label text box with light blue (0x9999ff) backgruond color and 1 pixel 3D border
# effect
layer0.setDataLabelStyle().setBackground(0x9999ff, ChartDirector::Transparent, 1)

# Add a red (0xff0000) line layer to the chart using (data1, angle1)
layer1 = c.addLineLayer(data1, 0xff0000, "Open Loop Line")
layer1.setAngles(angles1)

# Set the line width to 2 pixels
layer1.setLineWidth(2)

# Use 11 pixel diamond symbols for the data points
layer1.setDataSymbol(ChartDirector::DiamondSymbol, 11)

# Set the line to open loop
layer1.setCloseLoop(false)

# Enable data label and set its format
layer1.setDataLabelFormat("({value},{angle})")

# Set the data label text box with light red (0xff9999) backgruond color and 1 pixel 3D border
# effect
layer1.setDataLabelStyle().setBackground(0xff9999, ChartDirector::Transparent, 1)

# Output the chart
c.makeChart("polarline.png")