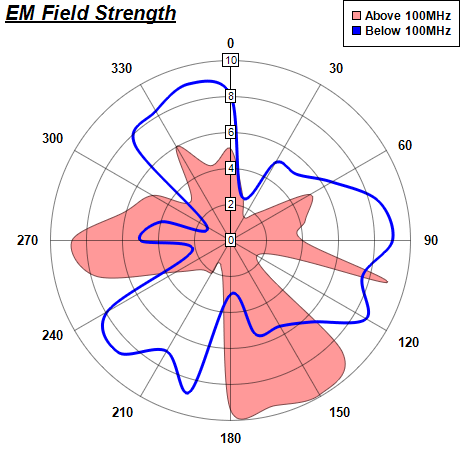
This example demonstrates polar spline line and polar spline area.
The polar spline line is created using PolarChart.addSplineLineLayer. The polar spline area is created using PolarChart.addSplineAreaLayer.
ChartDirector 6.0 (Ruby Edition)
Polar Spline Chart
Source Code Listing
require("chartdirector")

class PolarsplineController < ApplicationController

    def index()
        @title = "Polar Spline Chart"
        @ctrl_file = File.expand_path(__FILE__)
        @noOfCharts = 1
        render :template => "templates/chartview"
    end

    #
    # Render and deliver the chart
    #
    def getchart()
        # The data for the chart
        data0 = [5.1, 2.6, 1.5, 2.2, 5.1, 4.3, 4.0, 9.0, 1.7, 8.8, 9.9, 9.5, 9.4, 1.8, 2.1, 2.3,
            3.5, 7.7, 8.8, 6.1, 5.0, 3.1, 6.0, 4.3]
        angles0 = [0, 15, 30, 45, 60, 75, 90, 105, 120, 135, 150, 165, 180, 195, 210, 225, 240, 255,
            270, 285, 300, 315, 330, 345]

        data1 = [8.1, 2.5, 5, 5.2, 6.5, 8.5, 9, 7.6, 8.7, 6.4, 5.5, 5.4, 3.0, 8.7, 7.1, 8.8, 7.9,
            2.2, 5.0, 4.0, 1.5, 7.5, 8.3, 9.0]
        angles1 = [0, 15, 30, 45, 60, 75, 90, 105, 120, 135, 150, 165, 180, 195, 210, 225, 240, 255,
            270, 285, 300, 315, 330, 345]

        # Create a PolarChart object of size 460 x 460 pixels
        c = ChartDirector::PolarChart.new(460, 460)

        # Add a title to the chart at the top left corner using 15pt Arial Bold Italic font
        c.addTitle2(ChartDirector::TopLeft, "<*underline=2*>EM Field Strength", "arialbi.ttf", 15)

        # Set center of plot area at (230, 240) with radius 180 pixels
        c.setPlotArea(230, 240, 180)

        # Set the grid style to circular grid
        c.setGridStyle(false)

        # Add a legend box at the top right corner of the chart using 9pt Arial Bold font
        c.addLegend(459, 0, true, "arialbd.ttf", 9).setAlignment(ChartDirector::TopRight)

        # Set angular axis as 0 - 360, with a spoke every 30 units
        c.angularAxis().setLinearScale(0, 360, 30)

        # Add a red (0xff9999) spline area layer to the chart using (data0, angles0)
        c.addSplineAreaLayer(data0, 0xff9999, "Above 100MHz").setAngles(angles0)

        # Add a blue (0xff) spline line layer to the chart using (data1, angle1)
        layer1 = c.addSplineLineLayer(data1, 0x0000ff, "Below 100MHz")
        layer1.setAngles(angles1)

        # Set the line width to 3 pixels
        layer1.setLineWidth(3)

        # Output the chart
        send_data(c.makeChart2(ChartDirector::PNG), :type => "image/png", :disposition => "inline")

    end

end |
<html>
<body style="margin:5px 0px 0px 5px">

<!-- Title -->
<div style="font-size:18pt; font-family:verdana; font-weight:bold">
    <%= @title %>
</div>
<hr style="border:solid 1px #000080" />

<!-- Source Code Listing Link -->
<div style="font-size:9pt; font-family:verdana; margin-bottom:1.5em">
    <%= link_to "Source Code Listing",
        :controller => "cddemo", :action => "viewsource",
        :ctrl_file => @ctrl_file, :view_file => File.expand_path(__FILE__) %>
</div>

<!-- Create one or more IMG tags to display the demo chart(s) -->
<% 0.upto(@noOfCharts - 1) do |i| %>
    <img src="<%= url_for(:action => "getchart", :img => i) %>">
<% end %>

</body>
</html> |
#!/usr/bin/env ruby
require("chartdirector")

# The data for the chart
data0 = [5.1, 2.6, 1.5, 2.2, 5.1, 4.3, 4.0, 9.0, 1.7, 8.8, 9.9, 9.5, 9.4, 1.8, 2.1, 2.3, 3.5, 7.7,
    8.8, 6.1, 5.0, 3.1, 6.0, 4.3]
angles0 = [0, 15, 30, 45, 60, 75, 90, 105, 120, 135, 150, 165, 180, 195, 210, 225, 240, 255, 270,
    285, 300, 315, 330, 345]

data1 = [8.1, 2.5, 5, 5.2, 6.5, 8.5, 9, 7.6, 8.7, 6.4, 5.5, 5.4, 3.0, 8.7, 7.1, 8.8, 7.9, 2.2, 5.0,
    4.0, 1.5, 7.5, 8.3, 9.0]
angles1 = [0, 15, 30, 45, 60, 75, 90, 105, 120, 135, 150, 165, 180, 195, 210, 225, 240, 255, 270,
    285, 300, 315, 330, 345]

# Create a PolarChart object of size 460 x 460 pixels
c = ChartDirector::PolarChart.new(460, 460)

# Add a title to the chart at the top left corner using 15pt Arial Bold Italic font
c.addTitle2(ChartDirector::TopLeft, "<*underline=2*>EM Field Strength", "arialbi.ttf", 15)

# Set center of plot area at (230, 240) with radius 180 pixels
c.setPlotArea(230, 240, 180)

# Set the grid style to circular grid
c.setGridStyle(false)

# Add a legend box at the top right corner of the chart using 9pt Arial Bold font
c.addLegend(459, 0, true, "arialbd.ttf", 9).setAlignment(ChartDirector::TopRight)

# Set angular axis as 0 - 360, with a spoke every 30 units
c.angularAxis().setLinearScale(0, 360, 30)

# Add a red (0xff9999) spline area layer to the chart using (data0, angles0)
c.addSplineAreaLayer(data0, 0xff9999, "Above 100MHz").setAngles(angles0)

# Add a blue (0xff) spline line layer to the chart using (data1, angle1)
layer1 = c.addSplineLineLayer(data1, 0x0000ff, "Below 100MHz")
layer1.setAngles(angles1)

# Set the line width to 3 pixels
layer1.setLineWidth(3)

# Output the chart
c.makeChart("polarspline.png") |