require("chartdirector")
class Polarzones2Controller < ApplicationController
def index()
@title = "Sector Zones"
@ctrl_file = File.expand_path(__FILE__)
@noOfCharts = 1
render :template => "templates/chartview"
end
#
# Render and deliver the chart
#
def getchart()
# The data for the chart
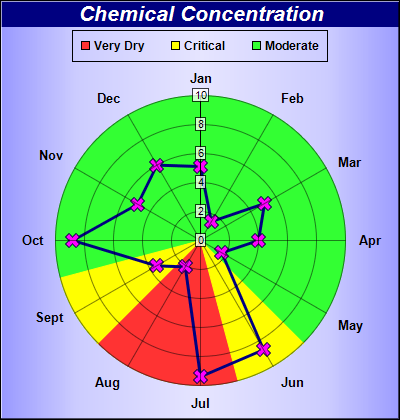
data = [5.1, 1.5, 5.1, 4.0, 1.7, 8.7, 9.4, 2.1, 3.5, 8.8, 5.0, 6.0]
# The labels for the chart
labels = ["Jan", "Feb", "Mar", "Apr", "May", "Jun", "Jul", "Aug", "Sept", "Oct", "Nov",
"Dec"]
# Create a PolarChart object of size 400 x 420 pixels. with a metallic blue (9999ff)
# background color and 1 pixel 3D border
c = ChartDirector::PolarChart.new(400, 420, ChartDirector::metalColor(0x9999ff), 0x000000, 1
)
# Add a title to the chart using 16pt Arial Bold Italic font. The title text is white
# (0xffffff) on deep blue (000080) background
c.addTitle("Chemical Concentration", "arialbi.ttf", 16, 0xffffff).setBackground(0x000080)
# Set center of plot area at (200, 240) with radius 145 pixels. Set background color to
# green (0x33ff33)
c.setPlotArea(200, 240, 145, 0x33ff33)
# Set the labels to the angular axis
c.angularAxis().setLabels(labels)
# Color the sector between label index = 5.5 to 7.5 as red (ff3333) zone
c.angularAxis().addZone(5.5, 7.5, 0xff3333)
# Color the sector between label index = 4.5 to 5.5, and also between 7.5 to 8.5, as yellow
# (ff3333) zones
c.angularAxis().addZone(4.5, 5.5, 0xffff00)
c.angularAxis().addZone(7.5, 8.5, 0xffff00)
# Set the grid style to circular grid
c.setGridStyle(false)
# Use semi-transparent (40ffffff) label background so as not to block the data
c.radialAxis().setLabelStyle().setBackground(0x40ffffff, 0x40000000)
# Add a legend box at (200, 30) top center aligned, using 9pt Arial Bold font. with a black
# border.
legendBox = c.addLegend(200, 30, false, "arialbd.ttf", 9)
legendBox.setAlignment(ChartDirector::TopCenter)
# Add legend keys to represent the red/yellow/green zones
legendBox.addKey("Very Dry", 0xff3333)
legendBox.addKey("Critical", 0xffff00)
legendBox.addKey("Moderate", 0x33ff33)
# Add a blue (0x80) line layer with line width set to 3 pixels and use purple (ff00ff) cross
# symbols for the data points
layer = c.addLineLayer(data, 0x000080)
layer.setLineWidth(3)
layer.setDataSymbol(ChartDirector::Cross2Shape(), 15, 0xff00ff)
# Output the chart
send_data(c.makeChart2(ChartDirector::PNG), :type => "image/png", :disposition => "inline")
end
end |