require("chartdirector")
class SemicirclemeterreadoutController < ApplicationController
def index()
@title = "Semicircle Meter with Readout"
@ctrl_file = File.expand_path(__FILE__)
@noOfCharts = 2
render :template => "templates/chartview"
end
#
# Render and deliver the chart
#
def getchart()
# This script can draw different charts depending on the chartIndex
chartIndex = (params["img"]).to_i
# The value to display on the meter
value = 66
# The background and border colors of the meters
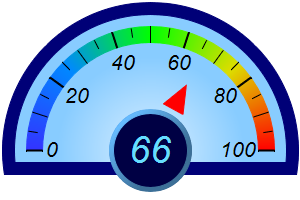
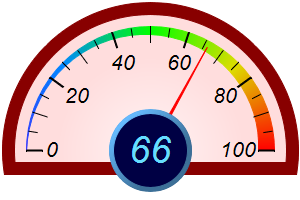
bgColor = [0x88ccff, 0xffdddd]
borderColor = [0x000077, 0x880000]
# Create an AngularMeter object of size 300 x 200 pixels with transparent background
m = ChartDirector::AngularMeter.new(300, 200, ChartDirector::Transparent)
# Center at (150, 150), scale radius = 124 pixels, scale angle -90 to +90 degrees
m.setMeter(150, 150, 124, -90, 90)
# Background gradient color with brighter color at the center
bgGradient = [0, m.adjustBrightness(bgColor[chartIndex], 3), 0.75, bgColor[chartIndex]]
# Add a scale background of 148 pixels radius using the background gradient, with a 13 pixel
# thick border
m.addScaleBackground(148, m.relativeRadialGradient(bgGradient), 13, borderColor[chartIndex])
# Meter scale is 0 - 100, with major tick every 20 units, minor tick every 10 units, and
# micro tick every 5 units
m.setScale(0, 100, 20, 10, 5)
# Set the scale label style to 15pt Arial Italic. Set the major/minor/micro tick lengths to
# 16/16/10 pixels pointing inwards, and their widths to 2/1/1 pixels.
m.setLabelStyle("ariali.ttf", 16)
m.setTickLength(-16, -16, -10)
m.setLineWidth(0, 2, 1, 1)
# Demostrate different types of color scales and putting them at different positions
smoothColorScale = [0, 0x3333ff, 25, 0x0088ff, 50, 0x00ff00, 75, 0xdddd00, 100, 0xff0000]
if chartIndex == 0
# Add the smooth color scale at the default position
m.addColorScale(smoothColorScale)
# Add a red (0xff0000) triangular pointer starting from 38% and ending at 60% of scale
# radius, with a width 6 times the default
m.addPointer2(value, 0xff0000, -1, ChartDirector::TriangularPointer2, 0.38, 0.6, 6)
else
# Add the smooth color scale starting at radius 124 with zero width and ending at radius
# 124 with 16 pixels inner width
m.addColorScale(smoothColorScale, 124, 0, 124, -16)
# Add a red (0xff0000) pointer
m.addPointer2(value, 0xff0000)
end
# Configure a large "pointer cap" to be used as the readout circle at the center. The cap
# radius and border width is set to 33% and 4% of the meter scale radius. The cap color is
# dark blue (0x000044). The border color is light blue (0x66bbff) with a 60% brightness
# gradient effect.
m.setCap2(ChartDirector::Transparent, 0x000044, 0x66bbff, 0.6, 0, 0.33, 0.04)
# Add value label at the center with light blue (0x66ddff) 28pt Arial Italic font
m.addText(150, 150, m.formatValue(value, "{value|0}"), "ariali.ttf", 28, 0x66ddff,
ChartDirector::Center).setMargin(0)
# Output the chart
send_data(m.makeChart2(ChartDirector::PNG), :type => "image/png", :disposition => "inline")
end
end |