Several ChartDirector API accept shape specification as arguments. For example, BarLayer.setBarShape and BarLayer.setBarShape2 can be used to specify shapes of bars in bar charts, while DataSet.setDataSymbol, DataSet.setDataSymbol4, PolarLayer.setDataSymbol, PolarLayer.setDataSymbol4, ThreeDScatterGroup.setDataSymbol and ThreeDScatterGroup.setDataSymbol4 be used to specify shapes of data symbols.
In addition to shapes, in certain chart types, ChartDirector also supports using images or custom draw objects for data representation. For example, see DataSet.setDataSymbol2, DataSet.setDataSymbol3, PolarLayer.setDataSymbol2, PolarLayer.setDataSymbol3, ThreeDScatterGroup.setDataSymbol2 and ThreeDScatterGroup.setDataSymbol3.
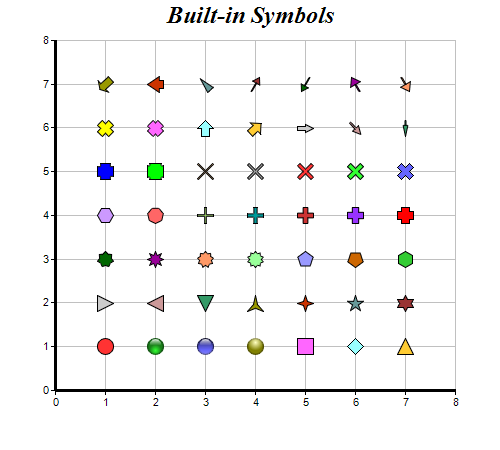
The following table illustrates the various ChartDirector shapes:
| Shape Id | Value | Description |
|---|---|---|
| SquareShape | 1 | Square shape. See (5, 1) above. |
| DiamondShape | 2 | Diamond shape. See (6, 1) above. |
| TriangleShape | 3 | Triangle shape pointing upwards. See (7, 1) above. |
| RightTriangleShape | 4 | Triangle shape pointing rightwards. See (1, 2) above. |
| LeftTriangleShape | 5 | Triangle shape pointing leftwards. See (2, 2) above. |
| InvertedTriangleShape | 6 | Triangle shape pointing downwards. See (3, 2) above. |
| CircleShape | 7 | Circle shape. See (1, 1) above. |
| GlassSphereShape | 15 | Glass sphere shape. See (2, 1) above. |
| GlassSphere2Shape | 16 | Bright glass sphere shape. See (3, 1) above. |
| SolidSphereShape | 17 | Solid sphere shape. See (4, 1) above. |
| StarShape | [Method] | Star shapes of various points. See (4, 2), (5, 2), (6, 2), (7, 2), (1, 3), (2, 3), (3, 3), (4, 3) above for stars with 3 to 10 points. |
| PolygonShape | [Method] | Polygon shapes symmetrical about a vertical axis with a vertex at the top center position. See (5, 3) and (7, 3) for polygons of 5 and 6 sides. |
| Polygon2Shape | [Method] | Polygon shapes symmetrical about a vertical axis but without any vertex at the top center position. See (6, 5), (1, 4), (2, 4) for polygons of 5, 6 and 7 sides. |
| CrossShape | [Method] | '+' shapes. See (3, 4), (4, 4), (5, 4), (6, 4), (7, 4), (1, 5), (2, 5) for '+' shape with arm width of 0.1 - 0.7. |
| Cross2Shape | [Method] | 'X' shapes. See (3, 5), (4, 5), (5, 5), (6, 5), (7, 5), (1, 6), (2, 6) for 'X' shapes with arm width of 0.1 - 0.7. |
| ArrowShape | [Method] | Arrow shapes. See (3, 6), (4, 6), (5, 6), (6, 6), (7, 6), (1, 7), (2, 7), (3, 7), (4, 7), (5, 7), (6, 7), (7, 7) for arrows of various angle, head width, stem width and stem length. |