require("chartdirector")
class StackedbarController < ApplicationController
def index()
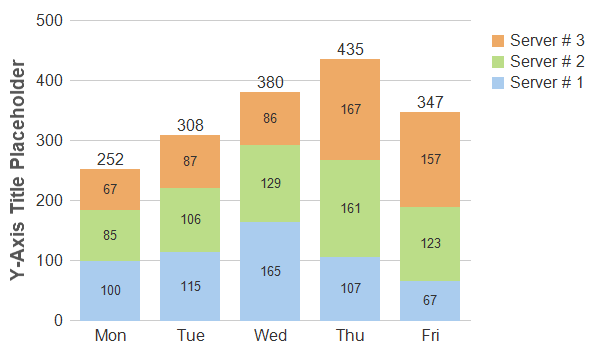
@title = "Stacked Bar Chart"
@ctrl_file = File.expand_path(__FILE__)
@noOfCharts = 1
render :template => "templates/chartview"
end
#
# Render and deliver the chart
#
def getchart()
# The data for the bar chart
data0 = [100, 115, 165, 107, 67]
data1 = [85, 106, 129, 161, 123]
data2 = [67, 87, 86, 167, 157]
# The labels for the bar chart
labels = ["Mon", "Tue", "Wed", "Thu", "Fri"]
# Create a XYChart object of size 600 x 360 pixels
c = ChartDirector::XYChart.new(600, 360)
# Set the plotarea at (70, 20) and of size 400 x 300 pixels, with transparent background and
# border and light grey (0xcccccc) horizontal grid lines
c.setPlotArea(70, 20, 400, 300, ChartDirector::Transparent, -1, ChartDirector::Transparent,
0xcccccc)
# Add a legend box at (480, 20) using vertical layout and 12pt Arial font. Set background
# and border to transparent and key icon border to the same as the fill color.
b = c.addLegend(480, 20, true, "arial.ttf", 12)
b.setBackground(ChartDirector::Transparent, ChartDirector::Transparent)
b.setKeyBorder(ChartDirector::SameAsMainColor)
# Set the x and y axis stems to transparent and the label font to 12pt Arial
c.xAxis().setColors(ChartDirector::Transparent)
c.yAxis().setColors(ChartDirector::Transparent)
c.xAxis().setLabelStyle("arial.ttf", 12)
c.yAxis().setLabelStyle("arial.ttf", 12)
# Add a stacked bar layer
layer = c.addBarLayer2(ChartDirector::Stack)
# Add the three data sets to the bar layer
layer.addDataSet(data0, 0xaaccee, "Server # 1")
layer.addDataSet(data1, 0xbbdd88, "Server # 2")
layer.addDataSet(data2, 0xeeaa66, "Server # 3")
# Set the bar border to transparent
layer.setBorderColor(ChartDirector::Transparent)
# Enable labelling for the entire bar and use 12pt Arial font
layer.setAggregateLabelStyle("arial.ttf", 12)
# Enable labelling for the bar segments and use 12pt Arial font with center alignment
layer.setDataLabelStyle("arial.ttf", 10).setAlignment(ChartDirector::Center)
# For a vertical stacked bar with positive data, the first data set is at the bottom. For
# the legend box, by default, the first entry at the top. We can reverse the legend order to
# make the legend box consistent with the stacked bar.
layer.setLegendOrder(ChartDirector::ReverseLegend)
# Set the labels on the x axis.
c.xAxis().setLabels(labels)
# For the automatic y-axis labels, set the minimum spacing to 40 pixels.
c.yAxis().setTickDensity(40)
# Add a title to the y axis using dark grey (0x555555) 14pt Arial Bold font
c.yAxis().setTitle("Y-Axis Title Placeholder", "arialbd.ttf", 14, 0x555555)
# Output the chart
send_data(c.makeChart2(ChartDirector::PNG), :type => "image/png", :disposition => "inline")
end
end |