require("chartdirector")
class SteplineController < ApplicationController
def index()
@title = "Step Line Chart"
@ctrl_file = File.expand_path(__FILE__)
@noOfCharts = 1
render :template => "templates/chartview"
end
#
# Render and deliver the chart
#
def getchart()
# The data for the chart
dataY0 = [4, 4.5, 5, 5.25, 5.75, 5.25, 5, 4.5, 4, 3, 2.5, 2.5]
dataX0 = [Time.mktime(1997, 1, 1), Time.mktime(1998, 6, 25), Time.mktime(1999, 9, 6),
Time.mktime(2000, 2, 6), Time.mktime(2000, 9, 21), Time.mktime(2001, 3, 4), Time.mktime(
2001, 6, 8), Time.mktime(2002, 2, 4), Time.mktime(2002, 5, 19), Time.mktime(2002, 8, 16
), Time.mktime(2002, 12, 1), Time.mktime(2003, 1, 1)]
dataY1 = [7, 6.5, 6, 5, 6.5, 7, 6, 5.5, 5, 4, 3.5, 3.5]
dataX1 = [Time.mktime(1997, 1, 1), Time.mktime(1997, 7, 1), Time.mktime(1997, 12, 1),
Time.mktime(1999, 1, 15), Time.mktime(1999, 6, 9), Time.mktime(2000, 3, 3), Time.mktime(
2000, 8, 13), Time.mktime(2001, 5, 5), Time.mktime(2001, 9, 16), Time.mktime(2002, 3, 16
), Time.mktime(2002, 6, 1), Time.mktime(2003, 1, 1)]
# Create a XYChart object of size 500 x 270 pixels, with a pale blue (e0e0ff) background,
# black border, 1 pixel 3D border effect and rounded corners
c = ChartDirector::XYChart.new(600, 300, 0xe0e0ff, 0x000000, 1)
c.setRoundedFrame()
# Set the plotarea at (55, 60) and of size 520 x 200 pixels, with white (ffffff) background.
# Set horizontal and vertical grid lines to grey (cccccc).
c.setPlotArea(50, 60, 525, 200, 0xffffff, -1, -1, 0xcccccc, 0xcccccc)
# Add a legend box at (55, 32) (top of the chart) with horizontal layout. Use 9pt Arial Bold
# font. Set the background and border color to Transparent.
c.addLegend(55, 32, false, "arialbd.ttf", 9).setBackground(ChartDirector::Transparent)
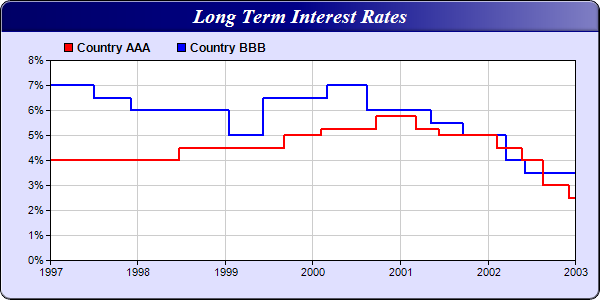
# Add a title box to the chart using 15pt Times Bold Italic font. The text is white (ffffff)
# on a deep blue (000088) background, with soft lighting effect from the right side.
c.addTitle("Long Term Interest Rates", "timesbi.ttf", 15, 0xffffff).setBackground(0x000088,
-1, ChartDirector::softLighting(ChartDirector::Right))
# Set the y axis label format to display a percentage sign
c.yAxis().setLabelFormat("{value}%")
# Add a red (ff0000) step line layer to the chart and set the line width to 2 pixels
layer0 = c.addStepLineLayer(dataY0, 0xff0000, "Country AAA")
layer0.setXData(dataX0)
layer0.setLineWidth(2)
# Add a blue (0000ff) step line layer to the chart and set the line width to 2 pixels
layer1 = c.addStepLineLayer(dataY1, 0x0000ff, "Country BBB")
layer1.setXData(dataX1)
layer1.setLineWidth(2)
# Output the chart
send_data(c.makeChart2(ChartDirector::PNG), :type => "image/png", :disposition => "inline")
end
end |