require("chartdirector")
class Surface2Controller < ApplicationController
def index()
@title = "Surface Chart (2)"
@ctrl_file = File.expand_path(__FILE__)
@noOfCharts = 1
render :template => "templates/chartview"
end
#
# Render and deliver the chart
#
def getchart()
# The x and y coordinates of the grid
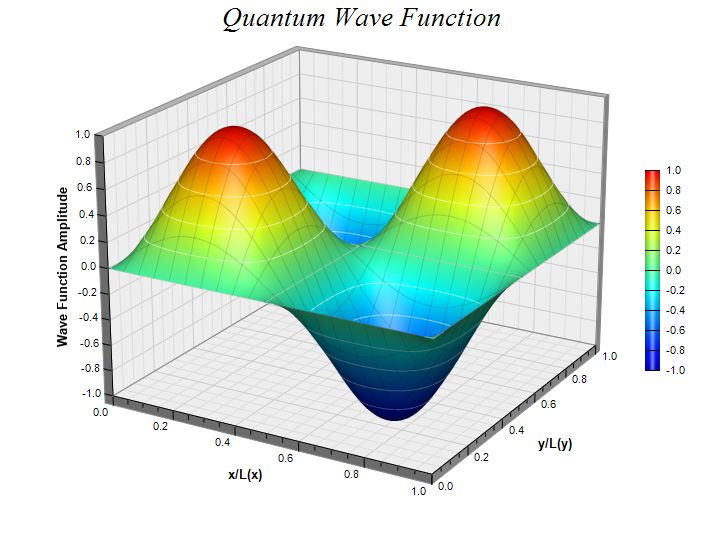
dataX = [0, 0.1, 0.2, 0.3, 0.4, 0.5, 0.6, 0.7, 0.8, 0.9, 1.0]
dataY = [0, 0.1, 0.2, 0.3, 0.4, 0.5, 0.6, 0.7, 0.8, 0.9, 1.0]
# The values at the grid points. In this example, we will compute the values using the
# formula z = sin((x - 0.5) * 2 * pi) * sin((y - 0.5) * 2 * pi)
dataZ = Array.new(dataX.length * dataY.length, 0)
0.upto(dataY.length - 1) do |yIndex|
y = (dataY[yIndex] - 0.5) * 2 * 3.1416
0.upto(dataX.length - 1) do |xIndex|
x = (dataX[xIndex] - 0.5) * 2 * 3.1416
dataZ[yIndex * dataX.length + xIndex] = Math.sin(x) * Math.sin(y)
end
end
# Create a SurfaceChart object of size 720 x 540 pixels
c = ChartDirector::SurfaceChart.new(720, 540)
# Add a title to the chart using 20 points Times New Roman Italic font
c.addTitle("Quantum Wave Function", "timesi.ttf", 20)
# Set the center of the plot region at (360, 245), and set width x depth x height to 360 x
# 360 x 270 pixels
c.setPlotRegion(360, 245, 360, 360, 270)
# Set the elevation and rotation angles to 20 and 30 degrees
c.setViewAngle(20, 30)
# Set the data to use to plot the chart
c.setData(dataX, dataY, dataZ)
# Spline interpolate data to a 80 x 80 grid for a smooth surface
c.setInterpolation(80, 80)
# Set surface grid lines to semi-transparent black (dd000000)
c.setSurfaceAxisGrid(0xdd000000)
# Set contour lines to semi-transparent white (80ffffff)
c.setContourColor(0x80ffffff)
# Add a color axis (the legend) in which the left center is anchored at (645, 270). Set the
# length to 200 pixels and the labels on the right side. Use smooth gradient coloring.
c.setColorAxis(645, 270, ChartDirector::Left, 200, ChartDirector::Right).setColorGradient()
# Set the x, y and z axis titles using 10 points Arial Bold font
c.xAxis().setTitle("x/L(x)", "arialbd.ttf", 10)
c.yAxis().setTitle("y/L(y)", "arialbd.ttf", 10)
c.zAxis().setTitle("Wave Function Amplitude", "arialbd.ttf", 10)
# Output the chart
send_data(c.makeChart2(ChartDirector::JPG), :type => "image/jpeg", :disposition => "inline")
end
end |