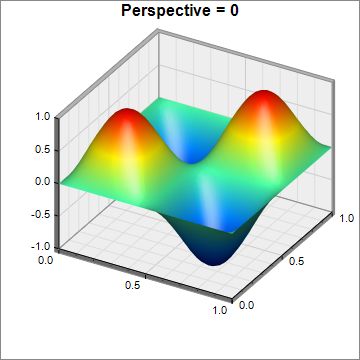
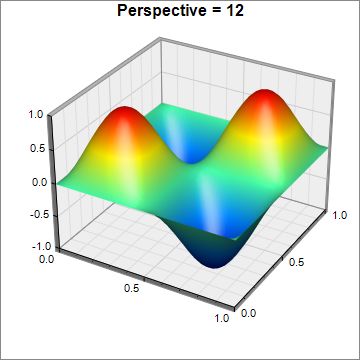
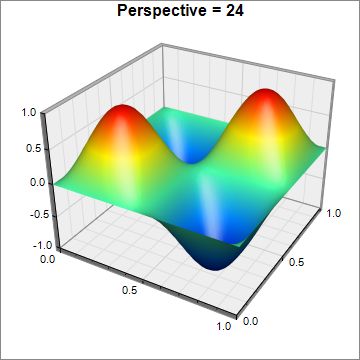
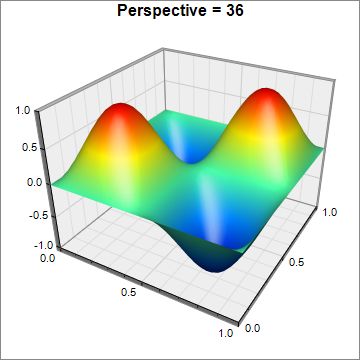
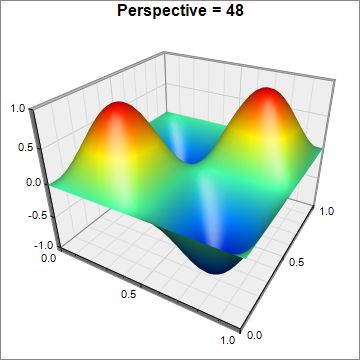
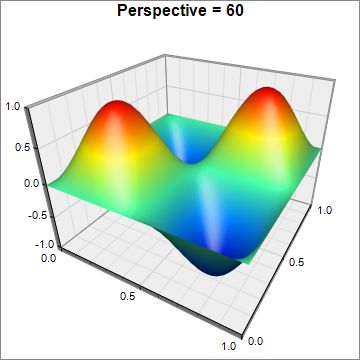
This example demonstrates the effects of various perspective depth, configured using ThreeDChart.setPerspective.
ChartDirector 6.0 (Ruby Edition)
Surface Perspective
Source Code Listing
require("chartdirector")

class SurfaceperspectiveController < ApplicationController

    def index()
        @title = "Surface Perspective"
        @ctrl_file = File.expand_path(__FILE__)
        @noOfCharts = 6
        render :template => "templates/chartview"
    end

    #
    # Render and deliver the chart
    #
    def getchart()
        # This script can draw different charts depending on the chartIndex
        chartIndex = (params["img"]).to_i

        # The x and y coordinates of the grid
        dataX = [0, 0.1, 0.2, 0.3, 0.4, 0.5, 0.6, 0.7, 0.8, 0.9, 1.0]
        dataY = [0, 0.1, 0.2, 0.3, 0.4, 0.5, 0.6, 0.7, 0.8, 0.9, 1.0]

        # The values at the grid points. In this example, we will compute the values using the
        # formula z = sin((x - 0.5) * 2 * pi) * sin((y - 0.5) * 2 * pi)
        dataZ = Array.new(dataX.length * dataY.length, 0)
        0.upto(dataY.length - 1) do |yIndex|
            y = (dataY[yIndex] - 0.5) * 2 * 3.1416
            0.upto(dataX.length - 1) do |xIndex|
                x = (dataX[xIndex] - 0.5) * 2 * 3.1416
                dataZ[yIndex * dataX.length + xIndex] = Math.sin(x) * Math.sin(y)
            end
        end

        # the perspective level
        perspective = chartIndex * 12

        # Create a SurfaceChart object of size 360 x 360 pixels, with white (ffffff) background and
        # grey (888888) border.
        c = ChartDirector::SurfaceChart.new(360, 360, 0xffffff, 0x888888)

        # Set the perspective level
        c.setPerspective(perspective)
        c.addTitle(sprintf("Perspective = %s", perspective))

        # Set the center of the plot region at (195, 165), and set width x depth x height to 200 x
        # 200 x 150 pixels
        c.setPlotRegion(195, 165, 200, 200, 150)

        # Set the plot region wall thichness to 5 pixels
        c.setWallThickness(5)

        # Set the elevation and rotation angles to 30 and 30 degrees
        c.setViewAngle(30, 30)

        # Set the data to use to plot the chart
        c.setData(dataX, dataY, dataZ)

        # Spline interpolate data to a 40 x 40 grid for a smooth surface
        c.setInterpolation(40, 40)

        # Use smooth gradient coloring.
        c.colorAxis().setColorGradient()

        # Output the chart
        send_data(c.makeChart2(ChartDirector::JPG), :type => "image/jpeg", :disposition => "inline")

    end

end |
<html>
<body style="margin:5px 0px 0px 5px">

<!-- Title -->
<div style="font-size:18pt; font-family:verdana; font-weight:bold">
    <%= @title %>
</div>
<hr style="border:solid 1px #000080" />

<!-- Source Code Listing Link -->
<div style="font-size:9pt; font-family:verdana; margin-bottom:1.5em">
    <%= link_to "Source Code Listing",
        :controller => "cddemo", :action => "viewsource",
        :ctrl_file => @ctrl_file, :view_file => File.expand_path(__FILE__) %>
</div>

<!-- Create one or more IMG tags to display the demo chart(s) -->
<% 0.upto(@noOfCharts - 1) do |i| %>
    <img src="<%= url_for(:action => "getchart", :img => i) %>">
<% end %>

</body>
</html> |
#!/usr/bin/env ruby
require("chartdirector")

def createChart(chartIndex)

    # The x and y coordinates of the grid
    dataX = [0, 0.1, 0.2, 0.3, 0.4, 0.5, 0.6, 0.7, 0.8, 0.9, 1.0]
    dataY = [0, 0.1, 0.2, 0.3, 0.4, 0.5, 0.6, 0.7, 0.8, 0.9, 1.0]

    # The values at the grid points. In this example, we will compute the values using the formula z
    # = sin((x - 0.5) * 2 * pi) * sin((y - 0.5) * 2 * pi)
    dataZ = Array.new(dataX.length * dataY.length, 0)
    0.upto(dataY.length - 1) do |yIndex|
        y = (dataY[yIndex] - 0.5) * 2 * 3.1416
        0.upto(dataX.length - 1) do |xIndex|
            x = (dataX[xIndex] - 0.5) * 2 * 3.1416
            dataZ[yIndex * dataX.length + xIndex] = Math.sin(x) * Math.sin(y)
        end
    end

    # the perspective level
    perspective = chartIndex * 12

    # Create a SurfaceChart object of size 360 x 360 pixels, with white (ffffff) background and grey
    # (888888) border.
    c = ChartDirector::SurfaceChart.new(360, 360, 0xffffff, 0x888888)

    # Set the perspective level
    c.setPerspective(perspective)
    c.addTitle(sprintf("Perspective = %s", perspective))

    # Set the center of the plot region at (195, 165), and set width x depth x height to 200 x 200 x
    # 150 pixels
    c.setPlotRegion(195, 165, 200, 200, 150)

    # Set the plot region wall thichness to 5 pixels
    c.setWallThickness(5)

    # Set the elevation and rotation angles to 30 and 30 degrees
    c.setViewAngle(30, 30)

    # Set the data to use to plot the chart
    c.setData(dataX, dataY, dataZ)

    # Spline interpolate data to a 40 x 40 grid for a smooth surface
    c.setInterpolation(40, 40)

    # Use smooth gradient coloring.
    c.colorAxis().setColorGradient()

    # Output the chart
    c.makeChart("surfaceperspective%s.jpg" % chartIndex)
end

createChart(0)
createChart(1)
createChart(2)
createChart(3)
createChart(4)
createChart(5) |