require("chartdirector")
class TexturedonutController < ApplicationController
def index()
@title = "Texture Donut Chart"
@ctrl_file = File.expand_path(__FILE__)
@noOfCharts = 1
render :template => "templates/chartview"
end
#
# Render and deliver the chart
#
def getchart()
# The data for the pie chart
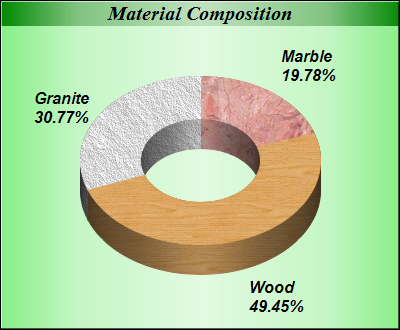
data = [18, 45, 28]
# The labels for the pie chart
labels = ["Marble", "Wood", "Granite"]
# The icons for the sectors
texture = ["marble3.png", "wood.png", "rock.png"]
# Create a PieChart object of size 400 x 330 pixels, with a metallic green (88EE88)
# background, black border and 1 pixel 3D border effect
c = ChartDirector::PieChart.new(400, 330, ChartDirector::metalColor(0x88ee88), 0x000000, 1)
# Set directory for loading images to current script directory
c.setSearchPath(File.dirname(__FILE__))
# Set donut center at (200, 160), and outer/inner radii as 120/60 pixels
c.setDonutSize(200, 160, 120, 60)
# Add a title box using 15pt Times Bold Italic font and metallic deep green (008000)
# background color
c.addTitle("Material Composition", "timesbi.ttf", 15).setBackground(
ChartDirector::metalColor(0x008000))
# Set the pie data and the pie labels
c.setData(data, labels)
# Set the colors of the sectors to the 3 texture patterns
c.setColor(ChartDirector::DataColor + 0, c.patternColor2(texture[0]))
c.setColor(ChartDirector::DataColor + 1, c.patternColor2(texture[1]))
c.setColor(ChartDirector::DataColor + 2, c.patternColor2(texture[2]))
# Draw the pie in 3D with a 3D depth of 30 pixels
c.set3D(30)
# Use 12pt Arial Bold Italic as the sector label font
c.setLabelStyle("arialbi.ttf", 12)
# Output the chart
send_data(c.makeChart2(ChartDirector::PNG), :type => "image/png", :disposition => "inline")
end
end |