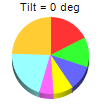
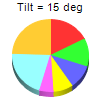
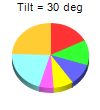
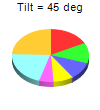
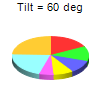
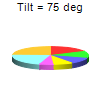
This example demonstrates the effects of different 3D angles.
ChartDirector allows the 3D depth and angles to be configured using
PieChart.set3D and
PieChart.set3D2.
This example also demonstrates how to disable sector labels. This is setting their colors to
Transparent using
PieChart.setLabelStyle.
[Ruby On Rails Version - Controller] app/controllers/threedanglepie_controller.rb
require("chartdirector")

class ThreedanglepieController < ApplicationController

    def index()
        @title = "3D Angle"
        @ctrl_file = File.expand_path(__FILE__)
        @noOfCharts = 7
        render :template => "templates/chartview"
    end

    #
    # Render and deliver the chart
    #
    def getchart()
        # This script can draw different charts depending on the chartIndex
        chartIndex = (params["img"]).to_i

        # the tilt angle of the pie
        angle = chartIndex * 15

        # The data for the pie chart
        data = [25, 18, 15, 12, 8, 30, 35]

        # Create a PieChart object of size 100 x 110 pixels
        c = ChartDirector::PieChart.new(100, 110)

        # Set the center of the pie at (50, 55) and the radius to 38 pixels
        c.setPieSize(50, 55, 38)

        # Set the depth and tilt angle of the 3D pie (-1 means auto depth)
        c.set3D(-1, angle)

        # Add a title showing the tilt angle
        c.addTitle(sprintf("Tilt = %s deg", angle), "arial.ttf", 8)

        # Set the pie data
        c.setData(data)

        # Disable the sector labels by setting the color to Transparent
        c.setLabelStyle("", 8, ChartDirector::Transparent)

        # Output the chart
        send_data(c.makeChart2(ChartDirector::PNG), :type => "image/png", :disposition => "inline")

    end

end |
[Ruby On Rails Version - View] app/views/templates/chartview.html.erb
<html>
<body style="margin:5px 0px 0px 5px">

<!-- Title -->
<div style="font-size:18pt; font-family:verdana; font-weight:bold">
    <%= @title %>
</div>
<hr style="border:solid 1px #000080" />

<!-- Source Code Listing Link -->
<div style="font-size:9pt; font-family:verdana; margin-bottom:1.5em">
    <%= link_to "Source Code Listing",
        :controller => "cddemo", :action => "viewsource",
        :ctrl_file => @ctrl_file, :view_file => File.expand_path(__FILE__) %>
</div>

<!-- Create one or more IMG tags to display the demo chart(s) -->
<% 0.upto(@noOfCharts - 1) do |i| %>
    <img src="<%= url_for(:action => "getchart", :img => i) %>">
<% end %>

</body>
</html> |
[Command Line Version] rubydemo/threedanglepie.rb
#!/usr/bin/env ruby
require("chartdirector")

def createChart(chartIndex)

    # the tilt angle of the pie
    angle = chartIndex * 15

    # The data for the pie chart
    data = [25, 18, 15, 12, 8, 30, 35]

    # Create a PieChart object of size 100 x 110 pixels
    c = ChartDirector::PieChart.new(100, 110)

    # Set the center of the pie at (50, 55) and the radius to 38 pixels
    c.setPieSize(50, 55, 38)

    # Set the depth and tilt angle of the 3D pie (-1 means auto depth)
    c.set3D(-1, angle)

    # Add a title showing the tilt angle
    c.addTitle(sprintf("Tilt = %s deg", angle), "arial.ttf", 8)

    # Set the pie data
    c.setData(data)

    # Disable the sector labels by setting the color to Transparent
    c.setLabelStyle("", 8, ChartDirector::Transparent)

    # Output the chart
    c.makeChart("threedanglepie%s.png" % chartIndex)
end

createChart(0)
createChart(1)
createChart(2)
createChart(3)
createChart(4)
createChart(5)
createChart(6) |
© 2017 Advanced Software Engineering Limited. All rights reserved.