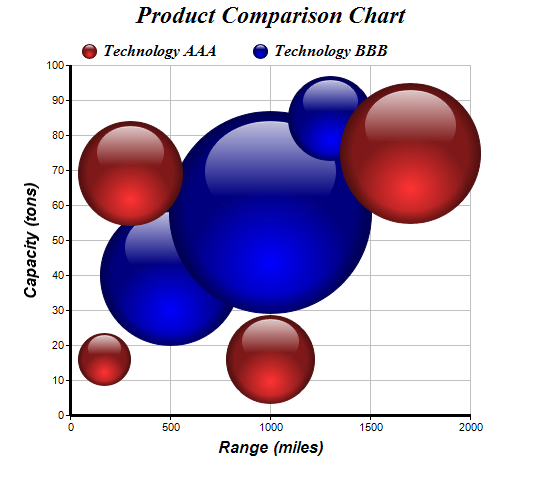
This examples demonstrates a bubble chart using glass spheres as bubbles.
ChartDirector 6.0 (Ruby Edition)
3D Bubble Chart (1)
Source Code Listing
require("chartdirector")

class ThreedbubbleController < ApplicationController

    def index()
        @title = "3D Bubble Chart (1)"
        @ctrl_file = File.expand_path(__FILE__)
        @noOfCharts = 1
        render :template => "templates/chartview"
    end

    #
    # Render and deliver the chart
    #
    def getchart()
        # The XYZ points for the bubble chart
        dataX0 = [170, 300, 1000, 1700]
        dataY0 = [16, 69, 16, 75]
        dataZ0 = [52, 105, 88, 140]

        dataX1 = [500, 1000, 1300]
        dataY1 = [40, 58, 85]
        dataZ1 = [140, 202, 84]

        # Create a XYChart object of size 540 x 480 pixels
        c = ChartDirector::XYChart.new(540, 480)

        # Set the plotarea at (70, 65) and of size 400 x 350 pixels. Turn on both horizontal and
        # vertical grid lines with light grey color (0xc0c0c0)
        c.setPlotArea(70, 65, 400, 350, -1, -1, ChartDirector::Transparent, 0xc0c0c0, -1)

        # Add a legend box at (70, 30) (top of the chart) with horizontal layout. Use 12pt Times
        # Bold Italic font. Set the background and border color to Transparent.
        c.addLegend(70, 30, false, "timesbi.ttf", 12).setBackground(ChartDirector::Transparent)

        # Add a title to the chart using 18pt Times Bold Itatic font.
        c.addTitle("Product Comparison Chart", "timesbi.ttf", 18)

        # Add titles to the axes using 12pt Arial Bold Italic font
        c.yAxis().setTitle("Capacity (tons)", "arialbi.ttf", 12)
        c.xAxis().setTitle("Range (miles)", "arialbi.ttf", 12)

        # Set the axes line width to 3 pixels
        c.xAxis().setWidth(3)
        c.yAxis().setWidth(3)

        # Add (dataX0, dataY0) as a scatter layer with red (ff3333) glass spheres, where the sphere
        # size is modulated by dataZ0. This creates a bubble effect.
        c.addScatterLayer(dataX0, dataY0, "Technology AAA", ChartDirector::GlassSphereShape, 15,
            0xff3333).setSymbolScale(dataZ0)

        # Add (dataX1, dataY1) as a scatter layer with blue (0000ff) glass spheres, where the sphere
        # size is modulated by dataZ1. This creates a bubble effect.
        c.addScatterLayer(dataX1, dataY1, "Technology BBB", ChartDirector::GlassSphereShape, 15,
            0x0000ff).setSymbolScale(dataZ1)

        # Output the chart
        send_data(c.makeChart2(ChartDirector::PNG), :type => "image/png", :disposition => "inline")

    end

end |
<html>
<body style="margin:5px 0px 0px 5px">

<!-- Title -->
<div style="font-size:18pt; font-family:verdana; font-weight:bold">
    <%= @title %>
</div>
<hr style="border:solid 1px #000080" />

<!-- Source Code Listing Link -->
<div style="font-size:9pt; font-family:verdana; margin-bottom:1.5em">
    <%= link_to "Source Code Listing",
        :controller => "cddemo", :action => "viewsource",
        :ctrl_file => @ctrl_file, :view_file => File.expand_path(__FILE__) %>
</div>

<!-- Create one or more IMG tags to display the demo chart(s) -->
<% 0.upto(@noOfCharts - 1) do |i| %>
    <img src="<%= url_for(:action => "getchart", :img => i) %>">
<% end %>

</body>
</html> |
#!/usr/bin/env ruby
require("chartdirector")

# The XYZ points for the bubble chart
dataX0 = [170, 300, 1000, 1700]
dataY0 = [16, 69, 16, 75]
dataZ0 = [52, 105, 88, 140]

dataX1 = [500, 1000, 1300]
dataY1 = [40, 58, 85]
dataZ1 = [140, 202, 84]

# Create a XYChart object of size 540 x 480 pixels
c = ChartDirector::XYChart.new(540, 480)

# Set the plotarea at (70, 65) and of size 400 x 350 pixels. Turn on both horizontal and vertical
# grid lines with light grey color (0xc0c0c0)
c.setPlotArea(70, 65, 400, 350, -1, -1, ChartDirector::Transparent, 0xc0c0c0, -1)

# Add a legend box at (70, 30) (top of the chart) with horizontal layout. Use 12pt Times Bold Italic
# font. Set the background and border color to Transparent.
c.addLegend(70, 30, false, "timesbi.ttf", 12).setBackground(ChartDirector::Transparent)

# Add a title to the chart using 18pt Times Bold Itatic font.
c.addTitle("Product Comparison Chart", "timesbi.ttf", 18)

# Add titles to the axes using 12pt Arial Bold Italic font
c.yAxis().setTitle("Capacity (tons)", "arialbi.ttf", 12)
c.xAxis().setTitle("Range (miles)", "arialbi.ttf", 12)

# Set the axes line width to 3 pixels
c.xAxis().setWidth(3)
c.yAxis().setWidth(3)

# Add (dataX0, dataY0) as a scatter layer with red (ff3333) glass spheres, where the sphere size is
# modulated by dataZ0. This creates a bubble effect.
c.addScatterLayer(dataX0, dataY0, "Technology AAA", ChartDirector::GlassSphereShape, 15, 0xff3333
    ).setSymbolScale(dataZ0)

# Add (dataX1, dataY1) as a scatter layer with blue (0000ff) glass spheres, where the sphere size is
# modulated by dataZ1. This creates a bubble effect.
c.addScatterLayer(dataX1, dataY1, "Technology BBB", ChartDirector::GlassSphereShape, 15, 0x0000ff
    ).setSymbolScale(dataZ1)

# Output the chart
c.makeChart("threedbubble.png") |