require("chartdirector")
class ThreeddonutController < ApplicationController
def index()
@title = "3D Donut Chart"
@ctrl_file = File.expand_path(__FILE__)
@noOfCharts = 1
render :template => "templates/chartview"
end
#
# Render and deliver the chart
#
def getchart()
# The data for the pie chart
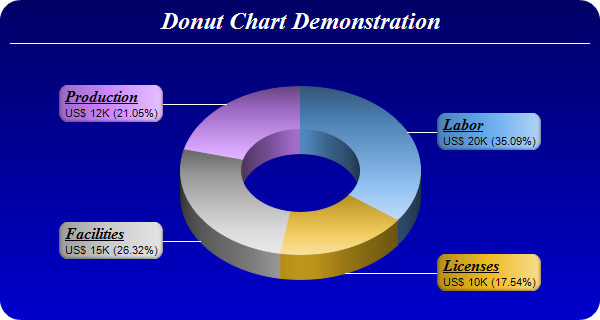
data = [20, 10, 15, 12]
# The labels for the pie chart
labels = ["Labor", "Licenses", "Facilities", "Production"]
# The colors to use for the sectors
colors = [0x66aaee, 0xeebb22, 0xcccccc, 0xcc88ff]
# Create a PieChart object of size 600 x 320 pixels. Use a vertical gradient color from deep
# blue (000066) to blue (0000cc) as background. Use rounded corners of 20 pixels radius.
c = ChartDirector::PieChart.new(600, 320)
c.setBackground(c.linearGradientColor(0, 0, 0, c.getHeight(), 0x000066, 0x0000cc))
c.setRoundedFrame(0xffffff, 20)
# Add a title using 18pt Times New Roman Bold Italic font in white (ffffff) color. Set
# top/bottom margins to 8 pixels.
title = c.addTitle("Donut Chart Demonstration", "timesbi.ttf", 18, 0xffffff)
title.setMargin2(0, 0, 8, 8)
# Add a separator line in white color just under the title
c.addLine(10, title.getHeight(), c.getWidth() - 11, title.getHeight(), 0xffffff)
# Set donut center at (300, 170), and outer/inner radii as 120/60 pixels
c.setDonutSize(300, 170, 120, 60)
# Draw the pie in 3D with a pie thickness of 25 pixels
c.set3D(25)
# Set the pie data and the pie labels
c.setData(data, labels)
# Set the sector colors
c.setColors2(ChartDirector::DataColor, colors)
# Use local gradient shading for the sectors
c.setSectorStyle(ChartDirector::LocalGradientShading)
# Set sector border color to same as fill color. Set label join line color to white (ffffff)
c.setLineColor(ChartDirector::SameAsMainColor, 0xffffff)
# Use the side label layout method, with the labels positioned 16 pixels from the donut
# bounding box
c.setLabelLayout(ChartDirector::SideLayout, 16)
# Set the sector label format. The label consists of two lines. The first line is the sector
# name in Times Bold Italic font and is underlined. The second line shows the data value and
# percentage.
c.setLabelFormat(
"<*block,halign=left*><*font=timesbi.ttf,size=12,underline=1*>{label}<*/font*><*br*>" \
"US$ {value}K ({percent}%)")
# Set the label box background color the same as the sector color. Use soft lighting effect
# with light direction from right. Use rounded corners.
t = c.setLabelStyle()
t.setBackground(ChartDirector::SameAsMainColor, ChartDirector::Transparent,
ChartDirector::softLighting(ChartDirector::Right))
t.setRoundedCorners()
# Output the chart
send_data(c.makeChart2(ChartDirector::PNG), :type => "image/png", :disposition => "inline")
end
end |