require("chartdirector")
class ThreedpieController < ApplicationController
def index()
@title = "3D Pie Chart"
@ctrl_file = File.expand_path(__FILE__)
@noOfCharts = 1
render :template => "templates/chartview"
end
#
# Render and deliver the chart
#
def getchart()
# The data for the pie chart
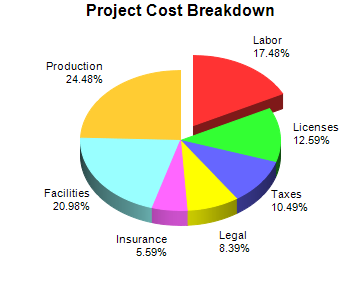
data = [25, 18, 15, 12, 8, 30, 35]
# The labels for the pie chart
labels = ["Labor", "Licenses", "Taxes", "Legal", "Insurance", "Facilities", "Production"]
# Create a PieChart object of size 360 x 300 pixels
c = ChartDirector::PieChart.new(360, 300)
# Set the center of the pie at (180, 140) and the radius to 100 pixels
c.setPieSize(180, 140, 100)
# Add a title to the pie chart
c.addTitle("Project Cost Breakdown")
# Draw the pie in 3D
c.set3D()
# Set the pie data and the pie labels
c.setData(data, labels)
# Explode the 1st sector (index = 0)
c.setExplode(0)
# Output the chart
send_data(c.makeChart2(ChartDirector::PNG), :type => "image/png", :disposition => "inline")
end
end |