require("chartdirector")
class ThreedscatteraxisController < ApplicationController
def index()
@title = "3D Scatter Axis Types"
@ctrl_file = File.expand_path(__FILE__)
@noOfCharts = 1
render :template => "templates/chartview"
end
#
# Render and deliver the chart
#
def getchart()
# The x coordinates for the 2 scatter groups
dataX = [Time.mktime(2011, 9, 1), Time.mktime(2011, 9, 2), Time.mktime(2011, 9, 3),
Time.mktime(2011, 9, 4), Time.mktime(2011, 9, 5), Time.mktime(2011, 9, 6), Time.mktime(
2011, 9, 7), Time.mktime(2011, 9, 8), Time.mktime(2011, 9, 9), Time.mktime(2011, 9, 10),
Time.mktime(2011, 9, 11)]
# The y and z coordinates for the first scatter group
dataY0 = [0.4, 0.2, 0.5, 0.4, 0.7, 1.3, 1.1, 1.0, 0.6, 0.4, 0.5]
dataZ0 = [43, 38, 33, 23.4, 28, 36, 34, 47, 53, 45, 40]
# The y and z coordinates for the second scatter group
dataY1 = [1.4, 1.0, 1.8, 1.9, 1.5, 1.0, 0.6, 0.7, 1.2, 1.7, 1.5]
dataZ1 = [46, 41, 33, 37, 28, 29, 34, 37, 41, 52, 50]
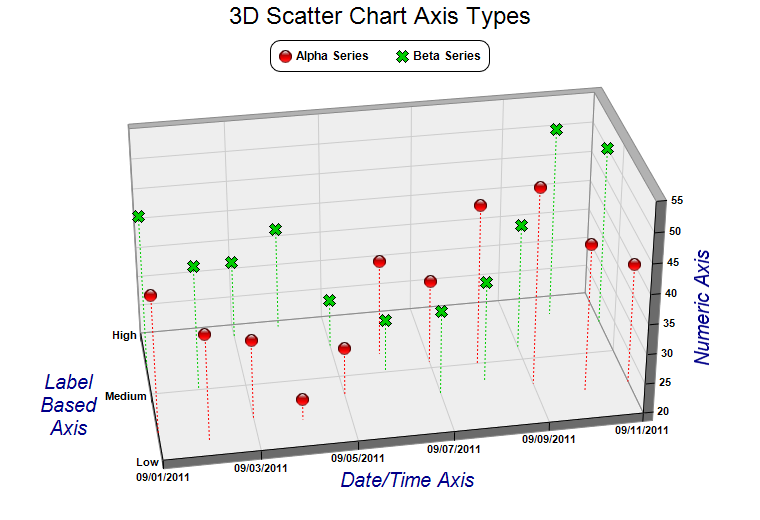
# Instead of displaying numeric values, labels are used for the y-axis
labelsY = ["Low", "Medium", "High"]
# Create a ThreeDScatterChart object of size 760 x 520 pixels
c = ChartDirector::ThreeDScatterChart.new(760, 520)
# Add a title to the chart using 18 points Arial font
c.addTitle("3D Scatter Chart Axis Types", "arial.ttf", 18)
# Set the center of the plot region at (385, 270), and set width x depth x height to 480 x
# 240 x 240 pixels
c.setPlotRegion(385, 270, 480, 240, 240)
# Set the elevation and rotation angles to 30 and -10 degrees
c.setViewAngle(30, -10)
# Add a legend box at (380, 40) with horizontal layout. Use 9pt Arial Bold font.
b = c.addLegend(380, 40, false, "arialbd.ttf", 9)
b.setAlignment(ChartDirector::TopCenter)
b.setRoundedCorners()
# Add a scatter group to the chart using 13 pixels red (ff0000) glass sphere symbols, with
# dotted drop lines
g0 = c.addScatterGroup(dataX, dataY0, dataZ0, "Alpha Series",
ChartDirector::GlassSphere2Shape, 13, 0xff0000)
g0.setDropLine(c.dashLineColor(ChartDirector::SameAsMainColor, ChartDirector::DotLine))
# Add a scatter group to the chart using 13 pixels blue (00cc00) cross symbols, with dotted
# drop lines
g1 = c.addScatterGroup(dataX, dataY1, dataZ1, "Beta Series", ChartDirector::Cross2Shape(),
13, 0x00cc00)
g1.setDropLine(c.dashLineColor(ChartDirector::SameAsMainColor, ChartDirector::DotLine))
# Set x-axis tick density to 50 pixels. ChartDirector auto-scaling will use this as the
# guideline when putting ticks on the x-axis.
c.xAxis().setTickDensity(50)
# Set the y-axis labels
c.yAxis().setLabels(labelsY)
# Set label style to Arial bold for all axes
c.xAxis().setLabelStyle("arialbd.ttf")
c.yAxis().setLabelStyle("arialbd.ttf")
c.zAxis().setLabelStyle("arialbd.ttf")
# Set the x, y and z axis titles using deep blue (000088) 15 points Arial font
c.xAxis().setTitle("Date/Time Axis", "ariali.ttf", 15, 0x000088)
c.yAxis().setTitle("Label\nBased\nAxis", "ariali.ttf", 15, 0x000088)
c.zAxis().setTitle("Numeric Axis", "ariali.ttf", 15, 0x000088)
# Output the chart
send_data(c.makeChart2(ChartDirector::PNG), :type => "image/png", :disposition => "inline")
end
end |