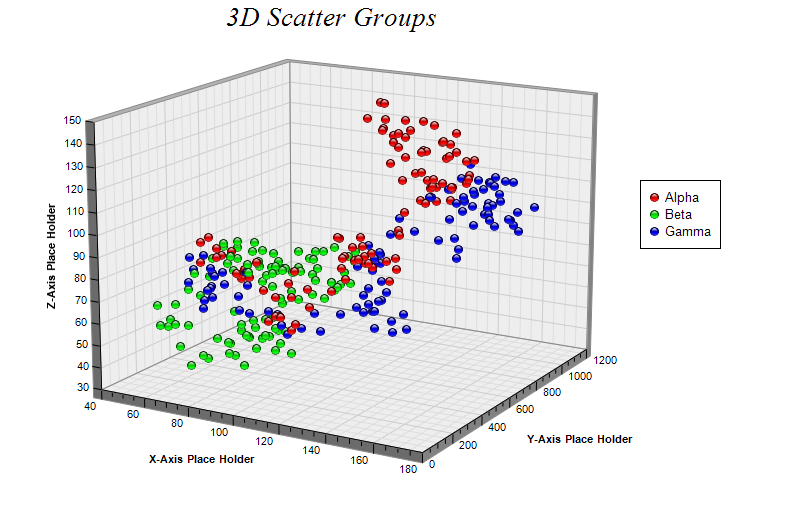
This example demonstrates multiple symbol groups by calling ThreeDScatterChart.addScatterGroup multiple times with different data and colors.
ChartDirector 6.0 (Ruby Edition)
3D Scatter Groups
Source Code Listing
require("chartdirector")

class ThreedscattergroupsController < ApplicationController

    def index()
        @title = "3D Scatter Groups"
        @ctrl_file = File.expand_path(__FILE__)
        @noOfCharts = 1
        render :template => "templates/chartview"
    end

    #
    # Render and deliver the chart
    #
    def getchart()
        # The random XYZ data for the first 3D scatter group
        r0 = ChartDirector::RanSeries.new(7)
        xData0 = r0.getSeries2(100, 100, -10, 10)
        yData0 = r0.getSeries2(100, 0, 0, 20)
        zData0 = r0.getSeries2(100, 100, -10, 10)

        # The random XYZ data for the second 3D scatter group
        r1 = ChartDirector::RanSeries.new(4)
        xData1 = r1.getSeries2(100, 100, -10, 10)
        yData1 = r1.getSeries2(100, 0, 0, 20)
        zData1 = r1.getSeries2(100, 100, -10, 10)

        # The random XYZ data for the third 3D scatter group
        r2 = ChartDirector::RanSeries.new(8)
        xData2 = r2.getSeries2(100, 100, -10, 10)
        yData2 = r2.getSeries2(100, 0, 0, 20)
        zData2 = r2.getSeries2(100, 100, -10, 10)

        # Create a ThreeDScatterChart object of size 800 x 520 pixels
        c = ChartDirector::ThreeDScatterChart.new(800, 520)

        # Add a title to the chart using 20 points Times New Roman Italic font
        c.addTitle("3D Scatter Groups                    ", "timesi.ttf", 20)

        # Set the center of the plot region at (350, 240), and set width x depth x height to 360 x
        # 360 x 270 pixels
        c.setPlotRegion(350, 240, 360, 360, 270)

        # Set the elevation and rotation angles to 15 and 30 degrees
        c.setViewAngle(15, 30)

        # Add a legend box at (640, 180)
        c.addLegend(640, 180)

        # Add 3 scatter groups to the chart with 9 pixels glass sphere symbols of red (ff0000),
        # green (00ff00) and blue (0000ff) colors
        c.addScatterGroup(xData0, yData0, zData0, "Alpha", ChartDirector::GlassSphere2Shape, 9,
            0xff0000)
        c.addScatterGroup(xData1, yData1, zData1, "Beta", ChartDirector::GlassSphere2Shape, 9,
            0x00ff00)
        c.addScatterGroup(xData2, yData2, zData2, "Gamma", ChartDirector::GlassSphere2Shape, 9,
            0x0000ff)

        # Set the x, y and z axis titles
        c.xAxis().setTitle("X-Axis Place Holder")
        c.yAxis().setTitle("Y-Axis Place Holder")
        c.zAxis().setTitle("Z-Axis Place Holder")

        # Output the chart
        send_data(c.makeChart2(ChartDirector::PNG), :type => "image/png", :disposition => "inline")

    end

end |
<html>
<body style="margin:5px 0px 0px 5px">

<!-- Title -->
<div style="font-size:18pt; font-family:verdana; font-weight:bold">
    <%= @title %>
</div>
<hr style="border:solid 1px #000080" />

<!-- Source Code Listing Link -->
<div style="font-size:9pt; font-family:verdana; margin-bottom:1.5em">
    <%= link_to "Source Code Listing",
        :controller => "cddemo", :action => "viewsource",
        :ctrl_file => @ctrl_file, :view_file => File.expand_path(__FILE__) %>
</div>

<!-- Create one or more IMG tags to display the demo chart(s) -->
<% 0.upto(@noOfCharts - 1) do |i| %>
    <img src="<%= url_for(:action => "getchart", :img => i) %>">
<% end %>

</body>
</html> |
#!/usr/bin/env ruby
require("chartdirector")

# The random XYZ data for the first 3D scatter group
r0 = ChartDirector::RanSeries.new(7)
xData0 = r0.getSeries2(100, 100, -10, 10)
yData0 = r0.getSeries2(100, 0, 0, 20)
zData0 = r0.getSeries2(100, 100, -10, 10)

# The random XYZ data for the second 3D scatter group
r1 = ChartDirector::RanSeries.new(4)
xData1 = r1.getSeries2(100, 100, -10, 10)
yData1 = r1.getSeries2(100, 0, 0, 20)
zData1 = r1.getSeries2(100, 100, -10, 10)

# The random XYZ data for the third 3D scatter group
r2 = ChartDirector::RanSeries.new(8)
xData2 = r2.getSeries2(100, 100, -10, 10)
yData2 = r2.getSeries2(100, 0, 0, 20)
zData2 = r2.getSeries2(100, 100, -10, 10)

# Create a ThreeDScatterChart object of size 800 x 520 pixels
c = ChartDirector::ThreeDScatterChart.new(800, 520)

# Add a title to the chart using 20 points Times New Roman Italic font
c.addTitle("3D Scatter Groups                    ", "timesi.ttf", 20)

# Set the center of the plot region at (350, 240), and set width x depth x height to 360 x 360 x 270
# pixels
c.setPlotRegion(350, 240, 360, 360, 270)

# Set the elevation and rotation angles to 15 and 30 degrees
c.setViewAngle(15, 30)

# Add a legend box at (640, 180)
c.addLegend(640, 180)

# Add 3 scatter groups to the chart with 9 pixels glass sphere symbols of red (ff0000), green
# (00ff00) and blue (0000ff) colors
c.addScatterGroup(xData0, yData0, zData0, "Alpha", ChartDirector::GlassSphere2Shape, 9, 0xff0000)
c.addScatterGroup(xData1, yData1, zData1, "Beta", ChartDirector::GlassSphere2Shape, 9, 0x00ff00)
c.addScatterGroup(xData2, yData2, zData2, "Gamma", ChartDirector::GlassSphere2Shape, 9, 0x0000ff)

# Set the x, y and z axis titles
c.xAxis().setTitle("X-Axis Place Holder")
c.yAxis().setTitle("Y-Axis Place Holder")
c.zAxis().setTitle("Z-Axis Place Holder")

# Output the chart
c.makeChart("threedscattergroups.png") |