<!DOCTYPE html>
<html>
<head>
<title>Track Line with Axis Labels</title>
<script type="text/javascript" src="/javascripts/cdjcv.js"></script>
</head>
<body style="margin:5px 0px 0px 5px">
<script type="text/javascript">
//
// Use the window load event to set up the MouseMovePlotArea event handler
//
JsChartViewer.addEventListener(window, 'load', function() {
var viewer = JsChartViewer.get('<%= @viewer.getId() %>');
// Draw track cursor when mouse is moving over plotarea. Hide it when mouse leaves plot area.
viewer.attachHandler(["MouseMovePlotArea", "TouchStartPlotArea", "TouchMovePlotArea", "ChartMove"],
function(e) {
this.preventDefault(e); // Prevent the browser from using touch events for other actions
trackLineAxis(viewer, viewer.getPlotAreaMouseX());
viewer.setAutoHide("all", ["MouseOutPlotArea", "TouchEndPlotArea"]);
});
});
//
// Draw track line with axis labels
//
function trackLineAxis(viewer, mouseX)
{
// Remove all previously drawn tracking object
viewer.hideObj("all");
// The chart and its plot area
var c = viewer.getChart();
var plotArea = c.getPlotArea();
// Get the data x-value that is nearest to the mouse, and find its pixel coordinate.
var xValue = c.getNearestXValue(mouseX);
var xCoor = c.getXCoor(xValue);
// The vertical track line is drawn up to the highest data point (the point with smallest
// y-coordinate). We need to iterate all datasets in all layers to determine where it is.
var minY = plotArea.getBottomY();
// Iterate through all layers to find the highest data point
for (var i = 0; i < c.getLayerCount(); ++i)
{
var layer = c.getLayerByZ(i);
// The data array index of the x-value
var xIndex = layer.getXIndexOf(xValue);
// Iterate through all the data sets in the layer
for (var j = 0; j < layer.getDataSetCount(); ++j)
{
var dataSet = layer.getDataSetByZ(j);
var yCoor = c.getYCoor(dataSet.getPosition(xIndex), dataSet.getUseYAxis());
if ((yCoor != null) && (dataSet.getDataColor() != null))
minY = Math.min(minY, yCoor);
}
}
// Draw a vertical track line at the x-position up to the highest data point.
viewer.drawVLine("trackLine", xCoor, Math.max(minY, plotArea.getTopY()),
plotArea.getBottomY() + 3, "black 1px dotted");
// Draw a label on the x-axis to show the track line position
viewer.showTextBox("xAxisLabel", xCoor, plotArea.getBottomY() + 3, JsChartViewer.Top,
c.xAxis().getFormattedLabel(xValue, "mmm dd, yyyy"),
"font:bold 11px Arial;color:#FFFFFF;background-color:#000000;padding:2px 3px");
// Iterate through all layers to draw the axis labels for the data points
for (var i = 0; i < c.getLayerCount(); ++i)
{
var layer = c.getLayerByZ(i);
// The data array index of the x-value
var xIndex = layer.getXIndexOf(xValue);
// Iterate through all the data sets in the layer
for (var j = 0; j < layer.getDataSetCount(); ++j)
{
var dataSet = layer.getDataSetByZ(j);
// The positional value, axis binding, pixel coordinate and color of the data point.
var dataPoint = dataSet.getPosition(xIndex);
var yAxis = dataSet.getUseYAxis();
var yCoor = c.getYCoor(dataPoint, yAxis);
var color = dataSet.getDataColor();
// Draw the axis label only for visible data points of named data sets
if ((yCoor != null) && (yCoor >= plotArea.getTopY()) && (yCoor <= plotArea.getBottomY()) &&
(color != null))
{
// The axis label consists of 3 parts - a track dot for the data point, an axis label,
// and a line joining the track dot to the axis label.
// Draw the line first. The end point of the line at the axis label side depends on
// whether the label is at the left or right side of the axis (that is, on whether
// the axis is on the left or right side of the plot area).
var xPos = yAxis.getX() + ((yAxis.getAlignment() == JsChartViewer.Left) ? -4 : 4);
viewer.drawHLine("joinLine" + i + "_" + j, yCoor, xPos, xCoor, color + " 1px dotted");
// Draw the axis label. If the axis is on the left side of the plot area, the labels
// should right aligned to the axis, and vice versa.
viewer.showTextBox("yAxisLabel" + i + "_" + j, xPos, yCoor,
(yAxis.getAlignment() == JsChartViewer.Left) ? JsChartViewer.Right : JsChartViewer.Left,
dataPoint.toPrecision(4), "padding:2px 3px;font:bold 11px Arial;background-color:" +
color + ";color:#FFFFFF;-webkit-text-size-adjust:100%;");
// Draw the track dot
viewer.showTextBox("dataPoint" + i + "_" + j, xCoor, yCoor, JsChartViewer.Center,
viewer.htmlRect(7, 7, color));
}
}
}
}
</script>
<div style="font-size:18pt; font-family:verdana; font-weight:bold">
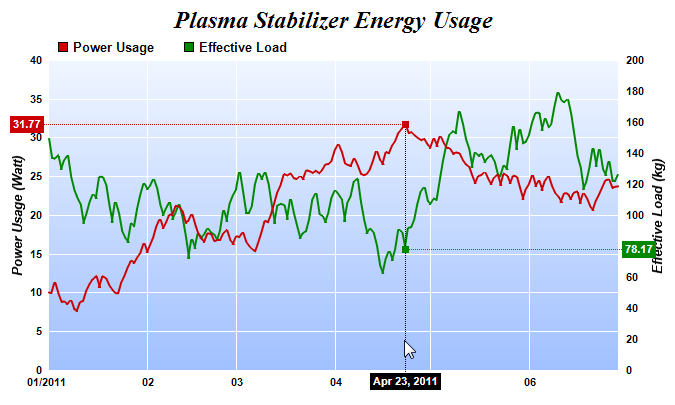
Track Line with Axis Labels
</div>
<hr style="border:solid 1px #000080" />
<div style="font-size:10pt; font-family:verdana; margin-bottom:1.5em">
<%= link_to "Source Code Listing",
:controller => "cddemo", :action => "viewsource",
:ctrl_file => @ctrl_file, :view_file => File.expand_path(__FILE__) %>
</div>
<!-- ****** Here is the chart image ****** -->
<%= raw(@viewer.renderHTML()) %>
</body>
</html> |