ChartDirector 6.0 (Ruby Edition)

Track Line with Data Labels


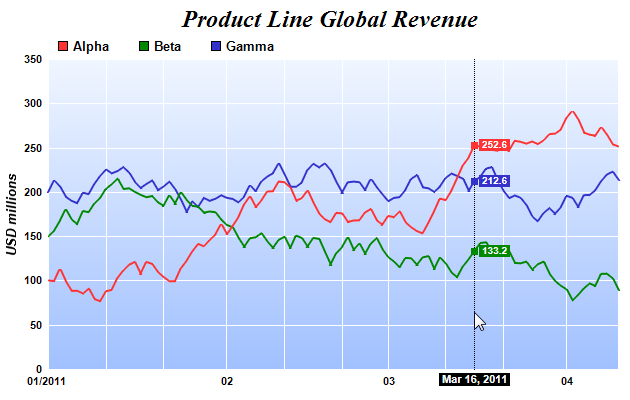
This sample program demonstrates a track cursor programmed with the following features:

On the server side, the code draws the chart as usual, and outputs both the image and the Javascript Chart Model of the chart.

On the browser side, in the window onload event handler, Javascript is used to set up the event handler for the MouseMovePlotArea, TouchStartPlotArea, TouchMovePlotArea and ChartMove events. The event handler calls trackLineLabel to draw the track cursor. It also calls JsChartViewer.setAutoHide to automatically hide the track cursor when the MouseOutPlotArea or TouchEndPlotArea event occurs.

The trackLineLabel Javascript function is the routine that draws the track cursor. Its key elements are:

Source Code Listing

[Ruby On Rails Version - Controller] app/controllers/tracklabel_controller.rb
require("chartdirector")

class TracklabelController < ApplicationController
    include ChartDirector::InteractiveChartSupport

    def index()
        @ctrl_file = File.expand_path(__FILE__)

        # Data for the chart as 3 random data series
        r = ChartDirector::RanSeries.new(127)
        data0 = r.getSeries(100, 100, -15, 15)
        data1 = r.getSeries(100, 150, -15, 15)
        data2 = r.getSeries(100, 200, -15, 15)
        timeStamps = r.getDateSeries(100, Time.mktime(2011, 1, 1), 86400)

        # Create a XYChart object of size 640 x 400 pixels
        c = ChartDirector::XYChart.new(640, 400)

        # Add a title to the chart using 18pt Times New Roman Bold Italic font
        c.addTitle("    Product Line Global Revenue", "timesbi.ttf", 18)

        # Set the plotarea at (50, 55) with width 70 pixels less than chart width, and height 90
        # pixels less than chart height. Use a vertical gradient from light blue (f0f6ff) to sky
        # blue (a0c0ff) as background. Set border to transparent and grid lines to white (ffffff).
        c.setPlotArea(50, 55, c.getWidth() - 70, c.getHeight() - 90, c.linearGradientColor(0, 55, 0,
            c.getHeight() - 35, 0xf0f6ff, 0xa0c0ff), -1, ChartDirector::Transparent, 0xffffff,
            0xffffff)

        # Add a legend box at (50, 25) using horizontal layout. Use 10pt Arial Bold as font. Set the
        # background and border color to Transparent.
        c.addLegend(50, 25, false, "arialbd.ttf", 10).setBackground(ChartDirector::Transparent)

        # Set axis label style to 8pt Arial Bold
        c.xAxis().setLabelStyle("arialbd.ttf", 8)
        c.yAxis().setLabelStyle("arialbd.ttf", 8)

        # Set the axis stem to transparent
        c.xAxis().setColors(ChartDirector::Transparent)
        c.yAxis().setColors(ChartDirector::Transparent)

        # Configure x-axis label format
        c.xAxis().setMultiFormat(ChartDirector::StartOfYearFilter(), "{value|mm/yyyy} ",
            ChartDirector::StartOfMonthFilter(), "{value|mm}")

        # Add axis title using 10pt Arial Bold Italic font
        c.yAxis().setTitle("USD millions", "arialbi.ttf", 10)

        # Add a line layer to the chart using a line width of 2 pixels.
        layer = c.addLineLayer2()
        layer.setLineWidth(2)

        # Add 3 data series to the line layer
        layer.setXData(timeStamps)
        layer.addDataSet(data0, 0xff3333, "Alpha")
        layer.addDataSet(data1, 0x008800, "Beta")
        layer.addDataSet(data2, 0x3333cc, "Gamma")

        # Create the WebChartViewer object
        @viewer = ChartDirector::WebChartViewer.new(request, "chart1")

        # Create the image and save it in a session variable
        session[@viewer.getId()] = c.makeChart2(ChartDirector::PNG)

        # Set the chart URL to the viewer
        @viewer.setImageUrl(url_for(:action => "get_session_data", :id => @viewer.getId(),
            :nocache => rand))

        # Output Javascript chart model to the browser to support tracking cursor
        @viewer.setChartModel(c.getJsChartModel())
    end

end

[Ruby On Rails Version - View] app/views/tracklabel/index.html.erb
<!DOCTYPE html>
<html>
<head>
    <title>Track Line with Data Labels</title>
    <script type="text/javascript" src="/javascripts/cdjcv.js"></script>
</head>
<body style="margin:5px 0px 0px 5px">
<script type="text/javascript">

//
// Use the window load event to set up the MouseMovePlotArea event handler
//
JsChartViewer.addEventListener(window, 'load', function() {
    var viewer = JsChartViewer.get('<%= @viewer.getId() %>');

    // Draw track cursor when mouse is moving over plotarea. Hide it when mouse leaves plot area.
    viewer.attachHandler(["MouseMovePlotArea", "TouchStartPlotArea", "TouchMovePlotArea", "ChartMove"],
    function(e) {
        this.preventDefault(e);   // Prevent the browser from using touch events for other actions
        trackLineLabel(viewer, viewer.getPlotAreaMouseX());
        viewer.setAutoHide("all", ["MouseOutPlotArea", "TouchEndPlotArea"]);
    });
});

//
// Draw track line with data labels
//
function trackLineLabel(viewer, mouseX)
{
    // Remove all previously drawn tracking object
    viewer.hideObj("all");

    // The chart and its plot area
    var c = viewer.getChart();
    var plotArea = c.getPlotArea();

    // Get the data x-value that is nearest to the mouse, and find its pixel coordinate.
    var xValue = c.getNearestXValue(mouseX);
    var xCoor = c.getXCoor(xValue);

    // Draw a vertical track line at the x-position
    viewer.drawVLine("trackLine", xCoor, plotArea.getTopY(), plotArea.getBottomY(), "black 1px dotted");

    // Draw a label on the x-axis to show the track line position
    viewer.showTextBox("xAxisLabel", xCoor, plotArea.getBottomY() + 4, JsChartViewer.Top,
        c.xAxis().getFormattedLabel(xValue, "mmm dd, yyyy"),
        "font:bold 11px Arial;color:#FFFFFF;background-color:#000000;padding:0px 3px");

    // Iterate through all layers to draw the data labels
    for (var i = 0; i < c.getLayerCount(); ++i)
    {
        var layer = c.getLayerByZ(i);

        // The data array index of the x-value
        var xIndex = layer.getXIndexOf(xValue);

        // Iterate through all the data sets in the layer
        for (var j = 0; j < layer.getDataSetCount(); ++j)
        {
            var dataSet = layer.getDataSetByZ(j);

            // Get the color and position of the data label
            var color = dataSet.getDataColor();
            var yCoor = c.getYCoor(dataSet.getPosition(xIndex), dataSet.getUseYAxis());

            // Draw a track dot with a label next to it for visible data points in the plot area
            if ((yCoor != null) && (yCoor >= plotArea.getTopY()) && (yCoor <= plotArea.getBottomY()) &&
                (color != null))
            {
                viewer.showTextBox("dataPoint" + i + "_" + j, xCoor, yCoor, JsChartViewer.Center,
                    viewer.htmlRect(7, 7, color));

                viewer.showTextBox("dataLabel" + i + "_" + j, xCoor + 5, yCoor, JsChartViewer.Left,
                    dataSet.getValue(xIndex).toPrecision(4), "padding:0px 3px;font:bold 11px Arial;" +
                    "background-color:" + color + ";color:#FFFFFF;-webkit-text-size-adjust:100%;");
            }
        }
    }
}

</script>
<div style="font-size:18pt; font-family:verdana; font-weight:bold">
    Track Line with Data Labels
</div>
<hr style="border:solid 1px #000080" />
<div style="font-size:10pt; font-family:verdana; margin-bottom:1.5em">
    <%= link_to "Source Code Listing",
        :controller => "cddemo", :action => "viewsource",
        :ctrl_file => @ctrl_file, :view_file => File.expand_path(__FILE__) %>
</div>
<!-- ****** Here is the chart image ****** -->
<%= raw(@viewer.renderHTML()) %>
</body>
</html>