This sample program demonstrates a track cursor programmed with the following features:
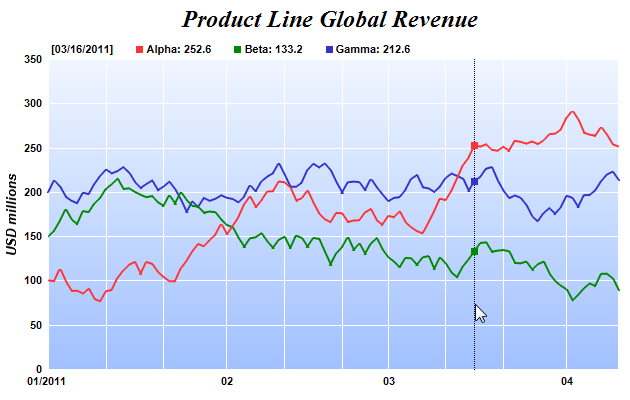
- A vertical line that follows the mouse cursor on the plot area and snaps to the nearest x data value.
- Small dots that shows the data points at the nearest x data value.
- Dynamically updated legend entries that shows the value of the data points at the nearest x data value.
On the browser side, in the window onload event handler, Javascript is used to set up the event handler for the MouseMovePlotArea, TouchStartPlotArea, TouchMovePlotArea , ChartMove and Now events. The event handler calls trackLineLegend to draw the track cursor.
The trackLineLegend Javascript function is the routine that draws the track cursor. Its key elements are:
- The code first uses JsChartViewer.hideObj to clear the previous track cursor, if any.
- The nearest x data value is obtained using JsXYChart.getNearestXValue.
- A vertical line is drawn at the nearest x data value using JsChartViewer.drawVLine.
- The code then iterates through all data sets in all layers to find all the data points at the nearest x data value. For each of these points, it formats a legend entry for the point, which consists of a colored square as the icon (creating using JsChartViewer.htmlRect), the data set name (obtained using JsDataSet.getDataName), and data value (obtained using JsDataSet.getValue). The code also gets the point's y position using DataSet.getPosition, and draws a square dot using JsChartViewer.showTextBox and JsChartViewer.htmlRect.
- Finally, the code combines all the legend entries and draws them at the top of the plot area using JsChartViewer.showTextBox.