This sample program demonstrates a track cursor programmed with the following features:
- A vertical line that follows the mouse cursor on the plot area and snaps to the nearest x data value.
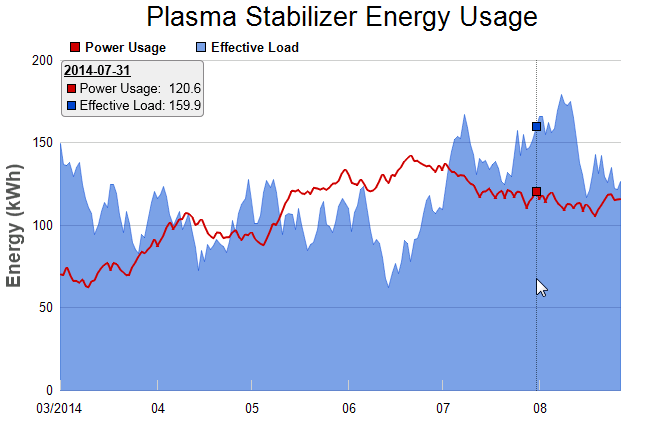
- Small dots that shows the data points at the nearest x data value.
- Dynamically updated legend entries that shows the value of the data points at the nearest x data value.
On the browser side, in the window onload event handler, Javascript is used to set up the event handler for the MouseMovePlotArea, TouchStartPlotArea, TouchMovePlotArea and ChartMove events. The event handler calls trackVLegend to draw the track cursor. It also calls JsChartViewer.setAutoHide to automatically hide the track cursor when the MouseOutPlotArea or TouchEndPlotArea event occurs.
The trackVLegend Javascript function is the routine that draws the track cursor. Its key elements are:
- The code first uses JsChartViewer.hideObj to clear the previous track cursor, if any.
- The nearest x data value is obtained using JsXYChart.getNearestXValue.
- A vertical line is drawn at the nearest x data value using JsChartViewer.drawVLine.
- The code then iterates through all data sets in all layers to find all the data points at the nearest x data value. For each of these points, it formats a legend entry for the point, which consists of a colored square as the icon (creating using JsChartViewer.htmlRect), the data set name (obtained using JsDataSet.getDataName), and data value (obtained using JsDataSet.getValue). The code also gets the point's y position using DataSet.getPosition, and draws a square dot using JsChartViewer.showTextBox and JsChartViewer.htmlRect.
- Finally, the code combines all the legend entries vertically and draws them at the top of the plot area using JsChartViewer.showTextBox. It puts the legend box on the left side of the plot area if the track cursor is on the right side and vice versa. This ensures the legend box would not block the region near the track cursor.