require("chartdirector")
class VbarmeterorientationController < ApplicationController
def index()
@title = "V-Bar Meter Orientation"
@ctrl_file = File.expand_path(__FILE__)
@noOfCharts = 4
render :template => "templates/chartview"
end
#
# Render and deliver the chart
#
def getchart()
# This script can draw different charts depending on the chartIndex
chartIndex = (params["img"]).to_i
# The value to display on the meter
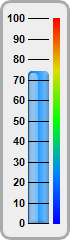
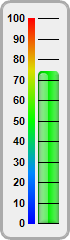
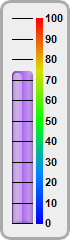
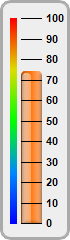
value = 74.25
# Bar colors of the meters
barColor = [0x2299ff, 0x00ee00, 0xaa66ee, 0xff7711]
# Create a LinearMeter object of size 70 x 240 pixels with very light grey (0xeeeeee)
# backgruond and a grey (0xaaaaaa) 3-pixel thick rounded frame
m = ChartDirector::LinearMeter.new(70, 240, 0xeeeeee, 0xaaaaaa)
m.setRoundedFrame(ChartDirector::Transparent)
m.setThickFrame(3)
# This example demonstrates putting the text labels at the left or right side of the meter
# scale, and putting the color scale on the same side as the labels or on opposite side.
alignment = [ChartDirector::Left, ChartDirector::Left, ChartDirector::Right,
ChartDirector::Right]
meterXPos = [28, 38, 12, 21]
labelGap = [2, 12, 10, 2]
colorScalePos = [53, 28, 36, 10]
# Configure the position of the meter scale and which side to put the text labels
m.setMeter(meterXPos[chartIndex], 18, 20, 205, alignment[chartIndex])
# Set meter scale from 0 - 100, with a tick every 10 units
m.setScale(0, 100, 10)
# To put the color scale on the same side as the text labels, we need to increase the gap
# between the labels and the meter scale to make room for the color scale
m.setLabelPos(false, labelGap[chartIndex])
# Add a smooth color scale to the meter
smoothColorScale = [0, 0x0000ff, 25, 0x0088ff, 50, 0x00ff00, 75, 0xdddd00, 100, 0xff0000]
m.addColorScale(smoothColorScale, colorScalePos[chartIndex], 6)
# Add a bar from 0 to value with glass effect and 4 pixel rounded corners
m.addBar(0, value, barColor[chartIndex], ChartDirector::glassEffect(
ChartDirector::NormalGlare, ChartDirector::Left), 4)
# Output the chart
send_data(m.makeChart2(ChartDirector::PNG), :type => "image/png", :disposition => "inline")
end
end |