require("chartdirector")
class WaterfallController < ApplicationController
def index()
@title = "Waterfall Chart"
@ctrl_file = File.expand_path(__FILE__)
@noOfCharts = 1
render :template => "templates/chartview"
end
#
# Render and deliver the chart
#
def getchart()
# 4 data points to represent the cash flow for the Q1 - Q4
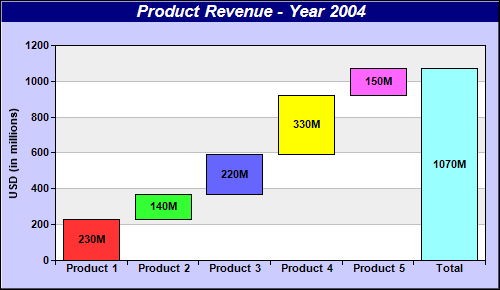
data = [230, 140, 220, 330, 150]
# We want to plot a waterfall chart showing the 4 quarters as well as the total
labels = ["Product 1", "Product 2", "Product 3", "Product 4", "Product 5", "Total"]
# The top side of the bars in a waterfall chart is the accumulated data. We use the
# ChartDirector ArrayMath utility to accumulate the data. The "total" is handled by
# inserting a zero point at the end before accumulation (after accumulation it will become
# the total).
boxTop = ChartDirector::ArrayMath.new(data).insert2(0, 1).acc().result()
# The botom side of the bars is just the top side of the previous bar. So we shifted the top
# side data to obtain the bottom side data.
boxBottom = ChartDirector::ArrayMath.new(boxTop).shift(1, 0).result()
# The last point (total) is different. Its bottom side is always 0.
boxBottom[boxBottom.length - 1] = 0
# Create a XYChart object of size 500 x 280 pixels. Set background color to light blue
# (ccccff), with 1 pixel 3D border effect.
c = ChartDirector::XYChart.new(500, 290, 0xccccff, 0x000000, 1)
# Add a title to the chart using 13 points Arial Bold Itatic font, with white (ffffff) text
# on a deep blue (0x80) background
c.addTitle("Product Revenue - Year 2004", "arialbi.ttf", 13, 0xffffff).setBackground(
0x000080)
# Set the plotarea at (55, 50) and of size 430 x 215 pixels. Use alternative white/grey
# background.
c.setPlotArea(55, 45, 430, 215, 0xffffff, 0xeeeeee)
# Set the labels on the x axis using Arial Bold font
c.xAxis().setLabels(labels).setFontStyle("arialbd.ttf")
# Set the x-axis ticks and grid lines to be between the bars
c.xAxis().setTickOffset(0.5)
# Use Arial Bold as the y axis label font
c.yAxis().setLabelStyle("arialbd.ttf")
# Add a title to the y axis
c.yAxis().setTitle("USD (in millions)")
# Add a multi-color box-whisker layer to represent the waterfall bars
layer = c.addBoxWhiskerLayer2(boxTop, boxBottom)
# Put data labels on the bars to show the cash flow using Arial Bold font
layer.setDataLabelFormat("{={top}-{bottom}}M")
layer.setDataLabelStyle("arialbd.ttf").setAlignment(ChartDirector::Center)
# Output the chart
send_data(c.makeChart2(ChartDirector::PNG), :type => "image/png", :disposition => "inline")
end
end |