require("chartdirector")
class WhiteroundmeterController < ApplicationController
def index()
@title = "White Round Meters"
@ctrl_file = File.expand_path(__FILE__)
@noOfCharts = 6
render :template => "templates/chartview"
end
#
# Render and deliver the chart
#
def getchart()
# This script can draw different charts depending on the chartIndex
chartIndex = (params["img"]).to_i
# The value to display on the meter
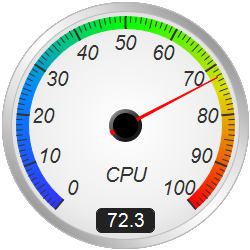
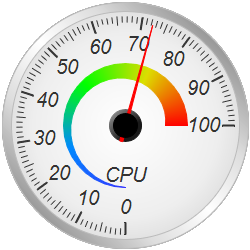
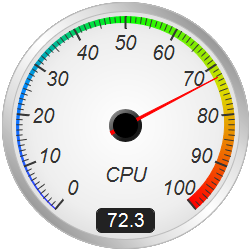
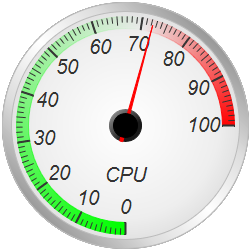
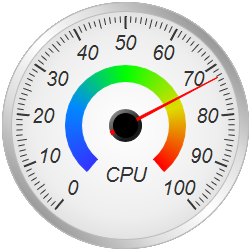
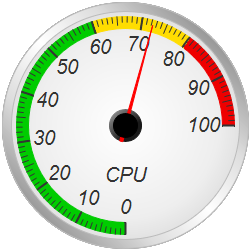
value = 72.3
# Create an AngularMeter object of size 250 x 250 pixels with transparent background
m = ChartDirector::AngularMeter.new(250, 250, ChartDirector::Transparent)
# Set the default text and line colors to dark grey (0x333333)
m.setColor(ChartDirector::TextColor, 0x333333)
m.setColor(ChartDirector::LineColor, 0x333333)
# Demonstration two different meter scale angles
if chartIndex % 2 == 0
# Center at (125, 125), scale radius = 111 pixels, scale angle -140 to +140 degrees
m.setMeter(125, 125, 109, -140, 140)
else
# Center at (125, 125), scale radius = 111 pixels, scale angle -180 to +90 degrees
m.setMeter(125, 125, 109, -180, 90)
end
# Add a black (0x000000) circle with radius 123 pixels as background
m.addRing(0, 123, 0x000000)
# Background gradient color from white (0xffffff) at the center to light grey (0xdddddd) at
# the border
bgGradient = [0, 0xffffff, 0.75, 0xeeeeee, 1, 0xdddddd]
# Add circle with radius 123 pixels as background using the background gradient
m.addRing(0, 123, m.relativeRadialGradient(bgGradient, 123))
# Gradient color for the border to make it silver-like
ringGradient = [1, 0x999999, 0.5, 0xdddddd, 0, 0xffffff, -0.5, 0xdddddd, -1, 0x999999]
# Add a ring between radii 114 and 123 pixels using the silver gradient with a light grey
# (0xbbbbbb) edge as the meter border
m.addRing(114, 123, m.relativeLinearGradient(ringGradient, 45, 123), 0xbbbbbb)
# Meter scale is 0 - 100, with major/minor/micro ticks every 10/5/1 units
m.setScale(0, 100, 10, 5, 1)
# Set the scale label style to 15pt Arial Italic. Set the major/minor/micro tick lengths to
# 12/9/6 pixels pointing inwards, and their widths to 2/1/1 pixels.
m.setLabelStyle("ariali.ttf", 15)
m.setTickLength(-12, -9, -6)
m.setLineWidth(0, 2, 1, 1)
# Demostrate different types of color scales and putting them at different positions
smoothColorScale = [0, 0x3333ff, 25, 0x0088ff, 50, 0x00ff00, 75, 0xdddd00, 100, 0xff0000]
stepColorScale = [0, 0x00cc00, 60, 0xffdd00, 80, 0xee0000, 100]
highLowColorScale = [0, 0x00ff00, 70, ChartDirector::Transparent, 100, 0xff0000]
if chartIndex == 0
# Add the smooth color scale at the default position
m.addColorScale(smoothColorScale)
elsif chartIndex == 1
# Add the smooth color scale starting at radius 62 with zero width and ending at radius
# 40 with 22 pixels outer width
m.addColorScale(smoothColorScale, 62, 0, 40, 22)
elsif chartIndex == 2
# Add the smooth color scale starting at radius 109 with zero width and ending at radius
# 109 with 12 pixels inner width
m.addColorScale(smoothColorScale, 109, 0, 109, -12)
elsif chartIndex == 3
# Add the high/low color scale at the default position
m.addColorScale(highLowColorScale)
elsif chartIndex == 4
# Add the smooth color scale at radius 44 with 16 pixels outer width
m.addColorScale(smoothColorScale, 44, 16)
else
# Add the step color scale at the default position
m.addColorScale(stepColorScale)
end
# Add a text label centered at (125, 175) with 15pt Arial Italic font
m.addText(125, 175, "CPU", "ariali.ttf", 15, ChartDirector::TextColor, ChartDirector::Center
)
# Add a readout to some of the charts as demonstration
if chartIndex == 0 || chartIndex == 2
# Put the value label center aligned at (125, 232), using white (0xffffff) 14pt Arial
# font on a dark grey (0x222222) background. Set box width to 50 pixels with 5 pixels
# rounded corners.
t = m.addText(125, 232, m.formatValue(value, "<*block,width=50,halign=center*>{value|1}"
), "arial.ttf", 14, 0xffffff, ChartDirector::BottomCenter)
t.setBackground(0x222222)
t.setRoundedCorners(5)
end
# Add a red (0xff0000) pointer at the specified value
m.addPointer2(value, 0xff0000)
# Output the chart
send_data(m.makeChart2(ChartDirector::PNG), :type => "image/png", :disposition => "inline")
end
end |