This example demonstrates vertical bar meters in a white coloring scheme, and with bars in various shading styles.
ChartDirector 6.0 (Ruby Edition)
White Vertical Bar Meters
Source Code Listing
require("chartdirector")
class WhitevbarmeterController < ApplicationController
def index()
@title = "White Vertical Bar Meters"
@ctrl_file = File.expand_path(__FILE__)
@noOfCharts = 6
render :template => "templates/chartview"
end
#
# Render and deliver the chart
#
def getchart()
# This script can draw different charts depending on the chartIndex
chartIndex = (params["img"]).to_i
# The value to display on the meter
value = 74.25
# Create a LinearMeter object of size 70 x 260 pixels with very light grey (0xeeeeee)
# backgruond and a grey (0xbbbbbb) 3-pixel thick rounded frame
m = ChartDirector::LinearMeter.new(70, 260, 0xeeeeee, 0xbbbbbb)
m.setRoundedFrame(ChartDirector::Transparent)
m.setThickFrame(3)
# Set the scale region top-left corner at (28, 33), with size of 20 x 194 pixels. The scale
# labels are located on the left (default - implies vertical meter).
m.setMeter(28, 33, 20, 194)
# Set meter scale from 0 - 100, with a tick every 10 units
m.setScale(0, 100, 10)
# Demostrate different types of color scales
smoothColorScale = [0, 0x0000ff, 25, 0x0088ff, 50, 0x00ff00, 75, 0xdddd00, 100, 0xff0000]
stepColorScale = [0, 0x00dd00, 50, 0xffff00, 80, 0xff0000, 100]
highColorScale = [70, ChartDirector::Transparent, 100, 0xff0000]
lowColorScale = [0, 0x0000ff, 30, ChartDirector::Transparent]
if chartIndex == 0
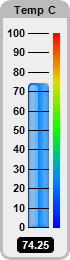
# Add a blue (0x0088ff) bar from 0 to value with glass effect and 4 pixel rounded
# corners
m.addBar(0, value, 0x0088ff, ChartDirector::glassEffect(ChartDirector::NormalGlare,
ChartDirector::Left), 4)
# Add a 6-pixel thick smooth color scale at x = 53 (right of meter scale)
m.addColorScale(smoothColorScale, 53, 6)
elsif chartIndex == 1
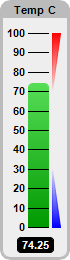
# Add a green (0x00cc00) bar from 0 to value with bar lighting effect and 4 pixel
# rounded corners
m.addBar(0, value, 0x00cc00, ChartDirector::barLighting(), 4)
# Add a high only color scale at x = 52 (right of meter scale) with thickness varying
# from 0 to 8
m.addColorScale(highColorScale, 52, 0, 52, 8)
# Add a low only color scale at x = 52 (right of meter scale) with thickness varying
# from 8 to 0
m.addColorScale(lowColorScale, 52, 8, 52, 0)
elsif chartIndex == 2
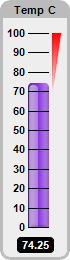
# Add a purple (0x0088ff) bar from 0 to value with glass effect and 4 pixel rounded
# corners
m.addBar(0, value, 0x8833dd, ChartDirector::glassEffect(ChartDirector::NormalGlare,
ChartDirector::Left), 4)
# Add a high only color scale at x = 52 (right of meter scale) with thickness varying
# from 0 to 8
m.addColorScale(highColorScale, 52, 0, 52, 8)
elsif chartIndex == 3
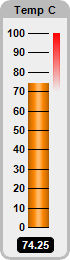
# Add a orange (0xff8800) bar from 0 to value with cylinder lighting effect
m.addBar(0, value, 0xff8800, ChartDirector::cylinderEffect())
# Add a high only color scale at x = 53 (right of meter scale)
m.addColorScale(highColorScale, 53, 6)
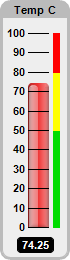
elsif chartIndex == 4
# Add a red (0xee3333) bar from 0 to value with glass effect and 4 pixel rounded corners
m.addBar(0, value, 0xee3333, ChartDirector::glassEffect(ChartDirector::NormalGlare,
ChartDirector::Left), 4)
# Add a step color scale at x = 53 (right of meter scale)
m.addColorScale(stepColorScale, 53, 6)
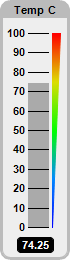
else
# Add a grey (0xaaaaaa) bar from 0 to value
m.addBar(0, value, 0xaaaaaa)
# Add a smooth color scale at x = 52 (right of meter scale) with thickness varying from
# 0 to 8
m.addColorScale(smoothColorScale, 52, 0, 52, 8)
end
# Add a title using 8pt Arial Bold font with grey (0xbbbbbb) background
m.addTitle("Temp C", "arialbd.ttf", 8, ChartDirector::TextColor).setBackground(0xbbbbbb)
# Add a text box at the bottom-center. Display the value using white (0xffffff) 8pt Arial
# Bold font on a black (0x000000) background with rounded border.
t = m.addText(m.getWidth() / 2, m.getHeight() - 8, m.formatValue(value, "2"), "arialbd.ttf",
8, 0xffffff, ChartDirector::Bottom)
t.setBackground(0x000000)
t.setRoundedCorners(3)
t.setMargin2(5, 5, 2, 1)
# Output the chart
send_data(m.makeChart2(ChartDirector::PNG), :type => "image/png", :disposition => "inline")
end
end |
<html>
<body style="margin:5px 0px 0px 5px">

<!-- Title -->
<div style="font-size:18pt; font-family:verdana; font-weight:bold">
    <%= @title %>
</div>
<hr style="border:solid 1px #000080" />

<!-- Source Code Listing Link -->
<div style="font-size:9pt; font-family:verdana; margin-bottom:1.5em">
    <%= link_to "Source Code Listing",
        :controller => "cddemo", :action => "viewsource",
        :ctrl_file => @ctrl_file, :view_file => File.expand_path(__FILE__) %>
</div>

<!-- Create one or more IMG tags to display the demo chart(s) -->
<% 0.upto(@noOfCharts - 1) do |i| %>
    <img src="<%= url_for(:action => "getchart", :img => i) %>">
<% end %>

</body>
</html> |
#!/usr/bin/env ruby
require("chartdirector")

def createChart(chartIndex)

    # The value to display on the meter
    value = 74.25

    # Create a LinearMeter object of size 70 x 260 pixels with very light grey (0xeeeeee) backgruond
    # and a grey (0xbbbbbb) 3-pixel thick rounded frame
    m = ChartDirector::LinearMeter.new(70, 260, 0xeeeeee, 0xbbbbbb)
    m.setRoundedFrame(ChartDirector::Transparent)
    m.setThickFrame(3)

    # Set the scale region top-left corner at (28, 33), with size of 20 x 194 pixels. The scale
    # labels are located on the left (default - implies vertical meter).
    m.setMeter(28, 33, 20, 194)

    # Set meter scale from 0 - 100, with a tick every 10 units
    m.setScale(0, 100, 10)

    # Demostrate different types of color scales
    smoothColorScale = [0, 0x0000ff, 25, 0x0088ff, 50, 0x00ff00, 75, 0xdddd00, 100, 0xff0000]
    stepColorScale = [0, 0x00dd00, 50, 0xffff00, 80, 0xff0000, 100]
    highColorScale = [70, ChartDirector::Transparent, 100, 0xff0000]
    lowColorScale = [0, 0x0000ff, 30, ChartDirector::Transparent]

    if chartIndex == 0
        # Add a blue (0x0088ff) bar from 0 to value with glass effect and 4 pixel rounded corners
        m.addBar(0, value, 0x0088ff, ChartDirector::glassEffect(ChartDirector::NormalGlare,
            ChartDirector::Left), 4)
        # Add a 6-pixel thick smooth color scale at x = 53 (right of meter scale)
        m.addColorScale(smoothColorScale, 53, 6)
    elsif chartIndex == 1
         # Add a green (0x00cc00) bar from 0 to value with bar lighting effect and 4 pixel rounded
         # corners
        m.addBar(0, value, 0x00cc00, ChartDirector::barLighting(), 4)
        # Add a high only color scale at x = 52 (right of meter scale) with thickness varying from 0
        # to 8
        m.addColorScale(highColorScale, 52, 0, 52, 8)
        # Add a low only color scale at x = 52 (right of meter scale) with thickness varying from 8
        # to 0
        m.addColorScale(lowColorScale, 52, 8, 52, 0)
    elsif chartIndex == 2
        # Add a purple (0x0088ff) bar from 0 to value with glass effect and 4 pixel rounded corners
        m.addBar(0, value, 0x8833dd, ChartDirector::glassEffect(ChartDirector::NormalGlare,
            ChartDirector::Left), 4)
        # Add a high only color scale at x = 52 (right of meter scale) with thickness varying from 0
        # to 8
        m.addColorScale(highColorScale, 52, 0, 52, 8)
    elsif chartIndex == 3
         # Add a orange (0xff8800) bar from 0 to value with cylinder lighting effect
        m.addBar(0, value, 0xff8800, ChartDirector::cylinderEffect())
        # Add a high only color scale at x = 53 (right of meter scale)
        m.addColorScale(highColorScale, 53, 6)
    elsif chartIndex == 4
        # Add a red (0xee3333) bar from 0 to value with glass effect and 4 pixel rounded corners
        m.addBar(0, value, 0xee3333, ChartDirector::glassEffect(ChartDirector::NormalGlare,
            ChartDirector::Left), 4)
        # Add a step color scale at x = 53 (right of meter scale)
        m.addColorScale(stepColorScale, 53, 6)
    else
         # Add a grey (0xaaaaaa) bar from 0 to value
        m.addBar(0, value, 0xaaaaaa)
        # Add a smooth color scale at x = 52 (right of meter scale) with thickness varying from 0 to
        # 8
        m.addColorScale(smoothColorScale, 52, 0, 52, 8)
    end

    # Add a title using 8pt Arial Bold font with grey (0xbbbbbb) background
    m.addTitle("Temp C", "arialbd.ttf", 8, ChartDirector::TextColor).setBackground(0xbbbbbb)

    # Add a text box at the bottom-center. Display the value using white (0xffffff) 8pt Arial Bold
    # font on a black (0x000000) background with rounded border.
    t = m.addText(m.getWidth() / 2, m.getHeight() - 8, m.formatValue(value, "2"), "arialbd.ttf", 8,
        0xffffff, ChartDirector::Bottom)
    t.setBackground(0x000000)
    t.setRoundedCorners(3)
    t.setMargin2(5, 5, 2, 1)

    # Output the chart
    m.makeChart("whitevbarmeter%s.png" % chartIndex)
end

createChart(0)
createChart(1)
createChart(2)
createChart(3)
createChart(4)
createChart(5) |