Track Cursors Clickable Charts Zooming/Scrolling Real-Time Charts
Pie Charts Bar Charts Line Charts Area Charts Trending Charts Box Charts Scatter Charts 3D Scatter Charts Contour Charts Surface Charts Discrete Heat Maps Tree Map Charts Bubble Charts Vector Charts Gantt Charts Finance Charts Polar Charts Radar Charts Pyramids/Funnels Combo Charts Angular Meters Linear Meters
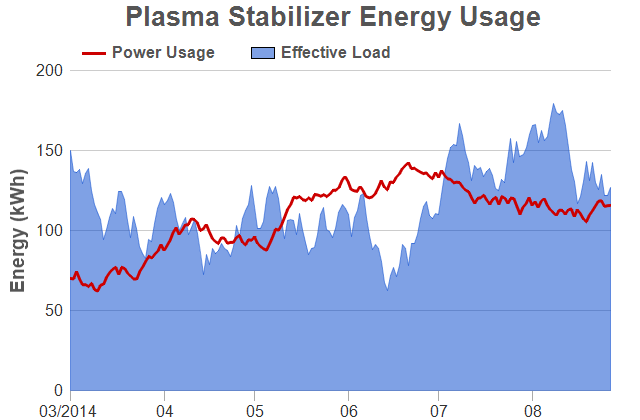
- An area layer with a line layer on top. The area layer is semi-transparent so you can see the grid lines under it.
|
|
|

|
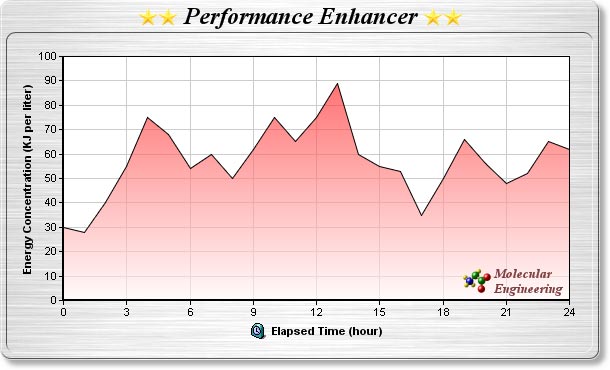
- A nicely designed area chart, using semi-transparent gradient color for the area region, on a brushed silver frame with a soft drop shadow.
- The chart title, axis title and logo are created using CDML, so they can contain icons.
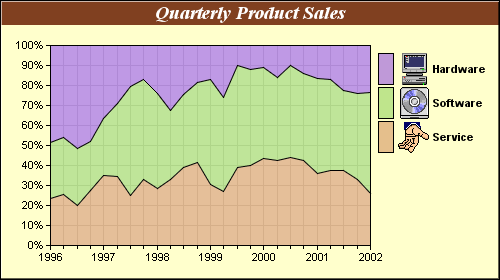
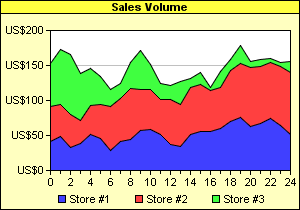
- A percentage area chart, in which the areas are automatically scaled so they always stacked up to 100%.
- The legend keys are created using CDML, so they can contain icons.
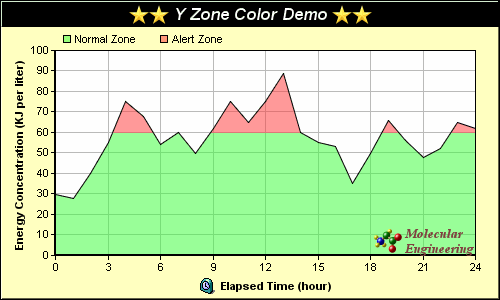
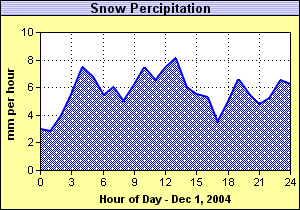
- An area chart demonstrating the zone color feature of ChartDirector.
- Zone colors are colors that can change abruptly at user-defined threshold positions. In this chart, the area is filled with a zone color configured to change at y = 60.
- The chart title, axis title and logo are created using CDML, so they can contain icons.