Track Cursors Clickable Charts Zooming/Scrolling Real-Time Charts
Pie Charts Bar Charts Line Charts Area Charts Trending Charts Box Charts Scatter Charts 3D Scatter Charts Contour Charts Surface Charts Discrete Heat Maps Tree Map Charts Bubble Charts Vector Charts Gantt Charts Finance Charts Polar Charts Radar Charts Pyramids/Funnels Combo Charts Angular Meters Linear Meters
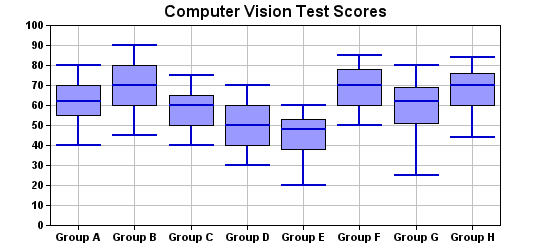
- A general box-whisker chart, which represents data ranges as boxes and/or marks. A common application is to represent the maximum, 3rd quartile, median, 1st quartile and minimum values of some statistics.
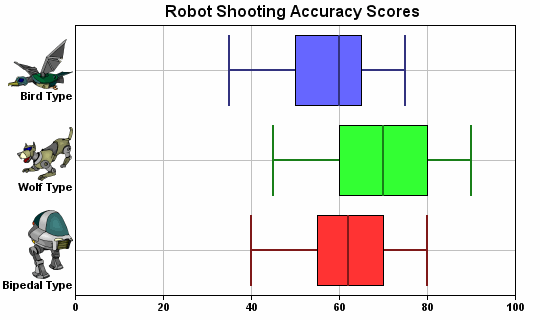
- A multi-color horizontal box-whisker chart. (All ChartDirector XY charts, including box-whisker chart, supports xy axis swapping.)
- The axis labels are created using CDML, so they can contain icons.
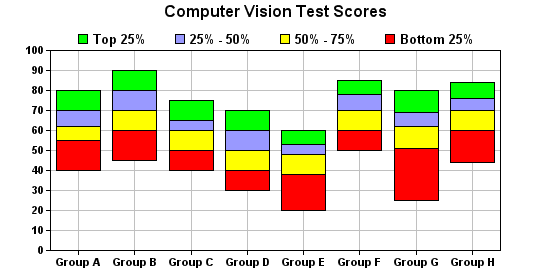
- A multi-color box chart created by using 4 box layers, each handling one data series.
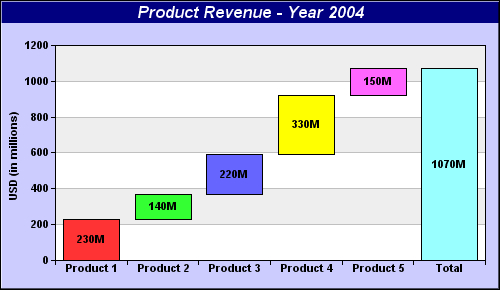
- This chart is an application of box chart often known as "Waterfall" chart. Each box represents a contribution to the total, and the last box shows the total.
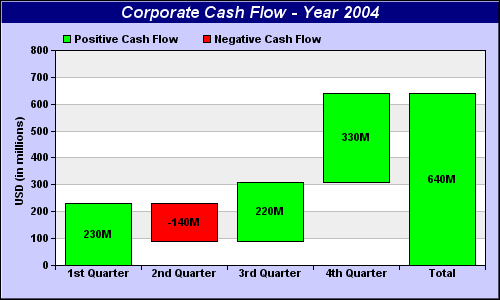
- This "Waterfall" chart uses two colors to clearly represent positive and negative contributions.