Track Cursors Clickable Charts Zooming/Scrolling Real-Time Charts
Pie Charts Bar Charts Line Charts Area Charts Trending Charts Box Charts Scatter Charts 3D Scatter Charts Contour Charts Surface Charts Discrete Heat Maps Tree Map Charts Bubble Charts Vector Charts Gantt Charts Finance Charts Polar Charts Radar Charts Pyramids/Funnels Combo Charts Angular Meters Linear Meters
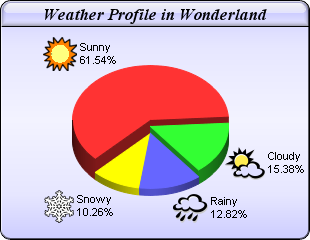
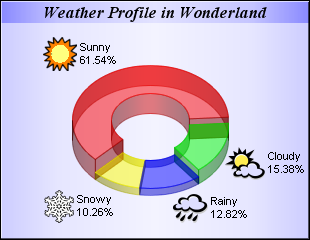
- Multi-depth 3D pie and donut charts, in which each sector has a different 3D depth.
- The pie chart has a gradient background, glass effect title bar and rounded corners. The donut chart uses semi-transparent colors and with metallic background effects.
- The sectors labels are configured using ChartDirector Mark Up Language (CDML), so they can contain icons.
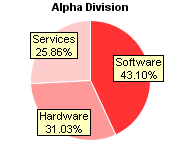
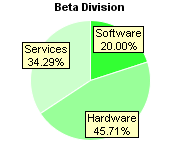
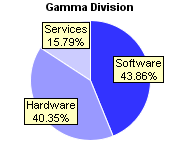
- This is just 3 simple pie charts. Even simple designs can look impressive when drawn with ChartDirector.
- The sector labels are configured to overlap with the sectors to save space.
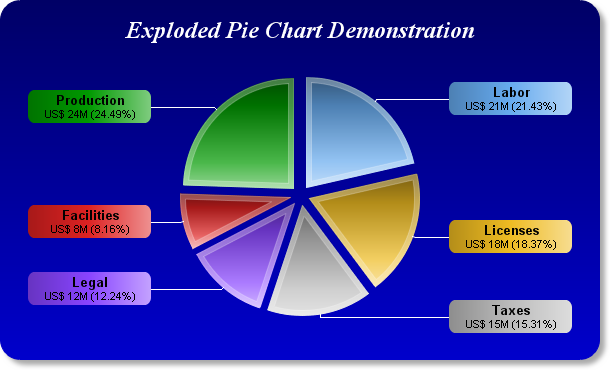
- A pie chart with all sectors exploded.
- The background, sectors and label box are all gradient colored. The background comes with a soft drop shadow. The sectors include thick inner borders.
- The sectors labels are configured using ChartDirector Mark Up Language (CDML).
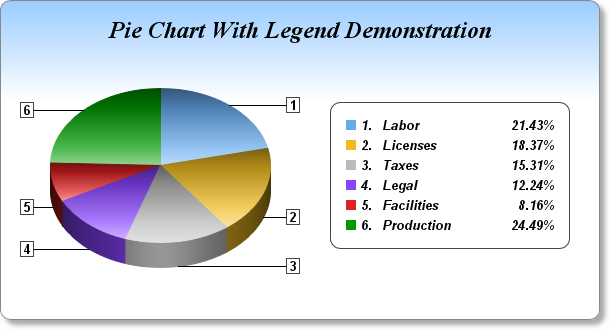
- A pie chart with a legend box.
- The sectors are numbered to make it easy to correspond to the legend, and readable even if printed on black and white media.
- Both the background and the sectors are gradient colored. The background includes a soft drop shadow.
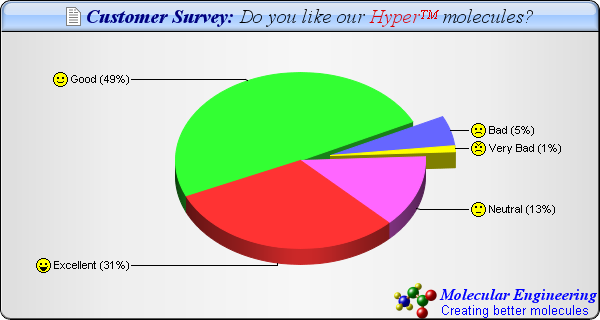
- A 3D pie chart a silver background, a glass effect title bar and a rounded frame.
- ChartDirector Mark Up Language (CDML) is used for the chart title, sector labels and custom text box (the logo). This allows the them to contain multiple fonts and colors and with icons.
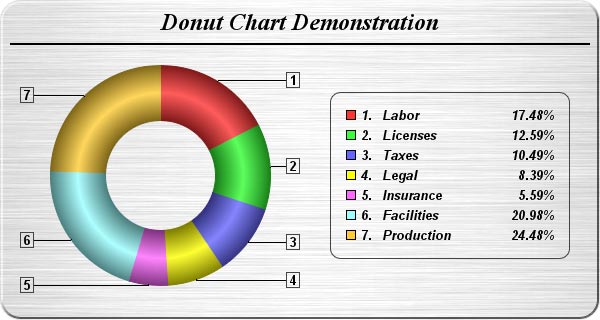
- A donut chart with a legend box, using a brushed silver background. The donut is gradient colored to give it a 3D look.
- The sectors are numbered to make it easy to correspond to the legend, and readable even if printed on black and white media.
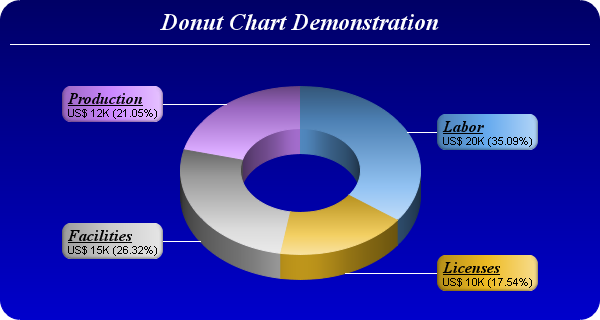
- A 3D donut chart, with the background, sectors and label box all gradient colored.
- Note also the sector label formats. They are configured using ChartDirector Mark Up Language (CDML).
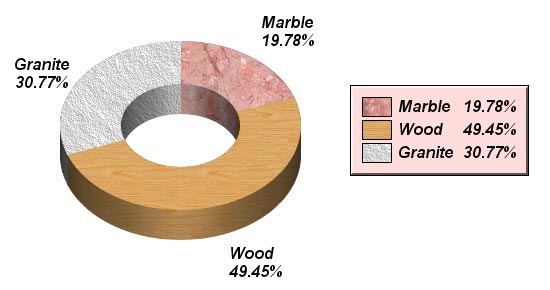
- The texture effects are achieved by using ChartDirector's "pattern color" feature, which allows any object to use wallpaper patterns as colors.