Track Cursors Clickable Charts Zooming/Scrolling Real-Time Charts
Pie Charts Bar Charts Line Charts Area Charts Trending Charts Box Charts Scatter Charts 3D Scatter Charts Contour Charts Surface Charts Discrete Heat Maps Tree Map Charts Bubble Charts Vector Charts Gantt Charts Finance Charts Polar Charts Radar Charts Pyramids/Funnels Combo Charts Angular Meters Linear Meters
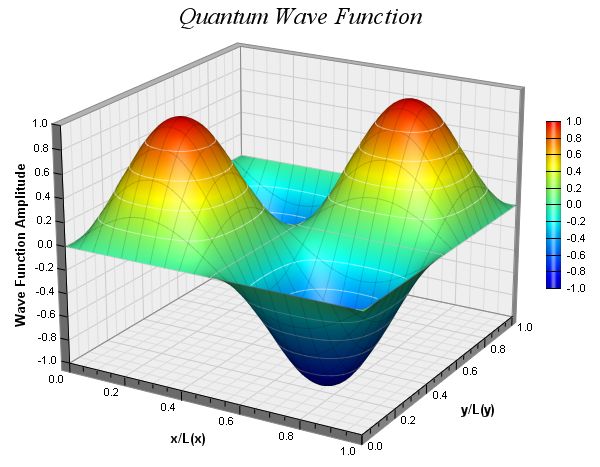
- A surface chart with lighting effects. The smooth surface is created using spline surface fitting of the data points.
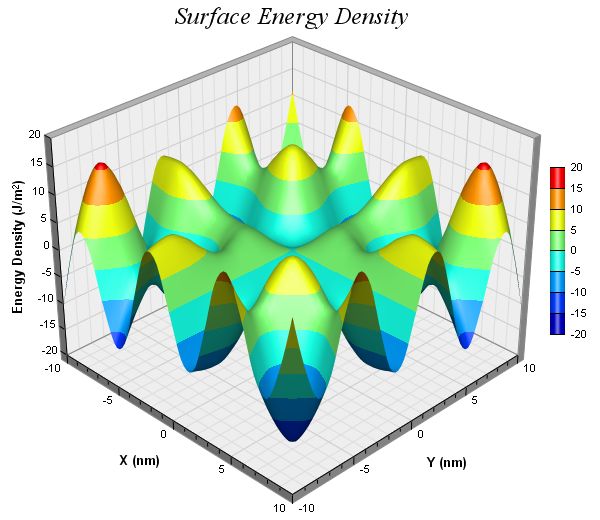
- A surface chart with continuous coloring and lighting effects, and with white contour lines and grey grid lines. The smooth surface is created using spline surface fitting of the data points.
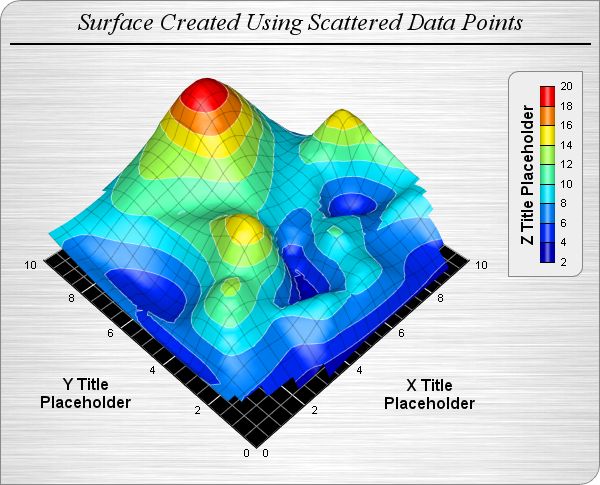
- A surface chart created using scattered data (data points are randomly distributed rather than lying on a grid), with the vertical walls hidden.
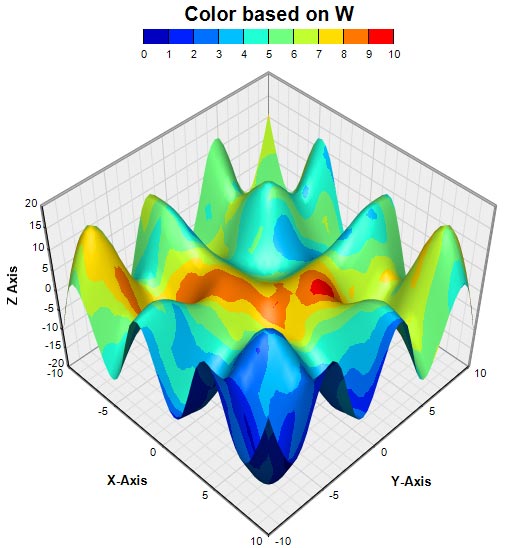
- 4D Surface Chart : The data of this chart contain 4 components (x, y, z, w). The (x, y, z) are used to generate the surface, while w is visualized as the surface color.
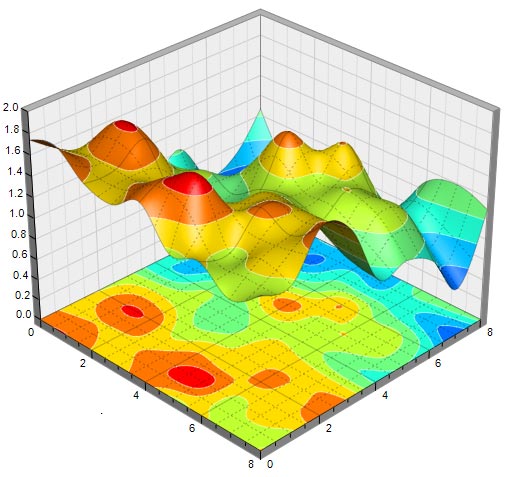
- Surface Projection: The surface can be projected onto the XY plane to visualize the contour chart of the surface.
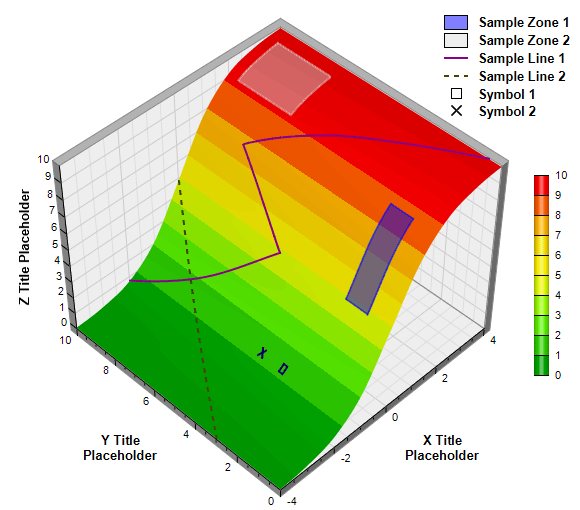
- Custom Lines, Zones and Symbols: You can add custom lines, zones and symbols to mark paths, regions and points on the surface.
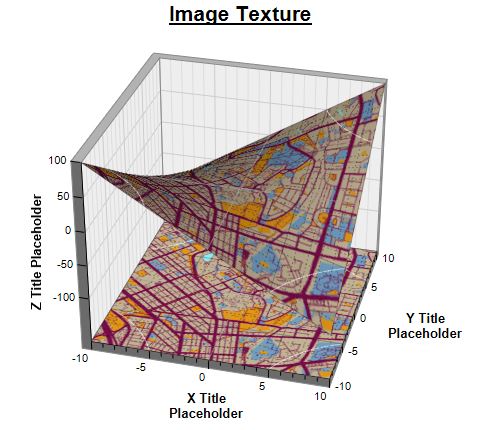
- Custom Surface Texture: For maximum flexibility, you can overlay a custom image on the surface. With this method, you can color the surface in anyway you like.
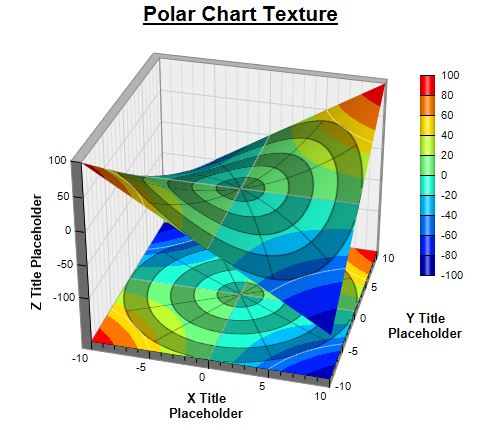
- Dynamic Image as Texture: The texture image can be dynamically generated. In this example, a semi-transparent polar chart is overlaid on the surface.