Track Cursors Clickable Charts Zooming/Scrolling Real-Time Charts
Pie Charts Bar Charts Line Charts Area Charts Trending Charts Box Charts Scatter Charts 3D Scatter Charts Contour Charts Surface Charts Discrete Heat Maps Tree Map Charts Bubble Charts Vector Charts Gantt Charts Finance Charts Polar Charts Radar Charts Pyramids/Funnels Combo Charts Angular Meters Linear Meters
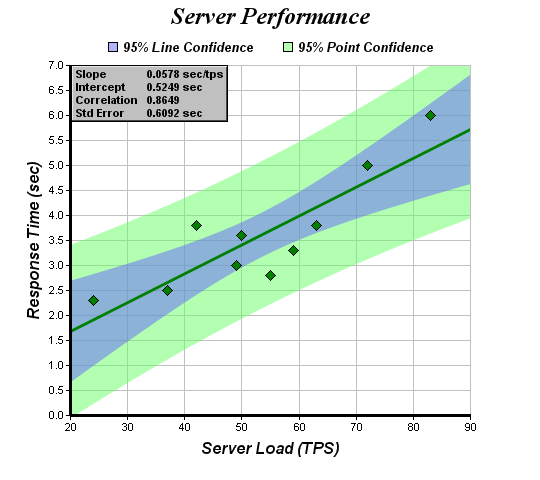
- A chart containing a scatter layer and a trend layer, demonstrating linear regression with line and point confidence bands.
- A custom text box is used on the top-left corner to display the regression parameters.
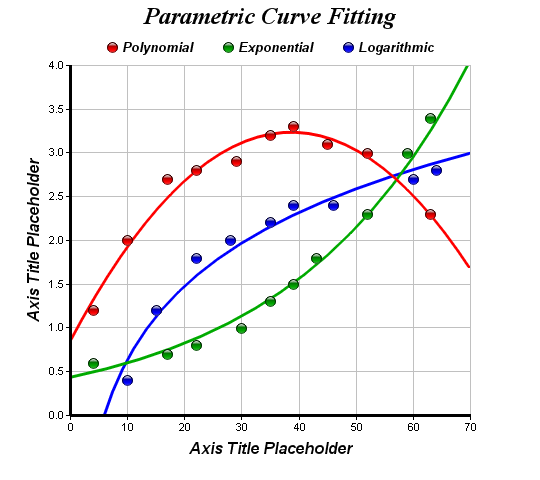
- A chart containing 3 scatter layers and 3 trend layers, demonstrating polynomial, exponential as well as logarthmic regression.
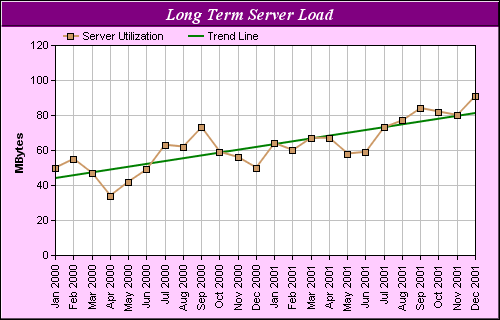
- A chart containing a line layer and a trend layer.
- Note that the x-axis labels are rotated by 90 degrees so they can be packed more tightly.

- A chart with a line layer and a spline layer.
- The spline line is computed using the LOWESS algorithm, which is a generic curve fitting algorithm supported by ChartDirector.