<cfscript>
// ChartDirector for ColdFusion API Access Point
cd = CreateObject("java", "ChartDirector.CFChart");
// A utility to allow us to create arrays with data in one line of code
function Array() {
var result = ArrayNew(1);
var i = 0;
for (i = 1; i LTE ArrayLen(arguments); i = i + 1)
result[i] = arguments[i];
return result;
}
// Function to create the demo charts
function createChart(chartIndex)
{
// Declare local variables
var data = 0;
var labels = 0;
var c = 0;
var ret = 0;
// The data for the pie chart
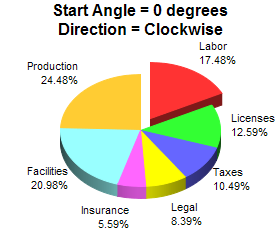
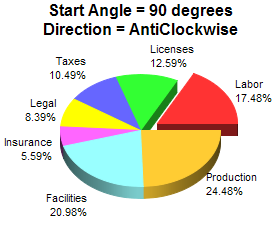
data = Array(25, 18, 15, 12, 8, 30, 35);
// The labels for the pie chart
labels = Array("Labor", "Licenses", "Taxes", "Legal", "Insurance", "Facilities", "Production");
// Create a PieChart object of size 280 x 240 pixels
c = cd.PieChart(280, 240);
// Set the center of the pie at (140, 130) and the radius to 80 pixels
c.setPieSize(140, 130, 80);
// Add a title to the pie to show the start angle and direction
if (chartIndex EQ 0) {
c.addTitle("Start Angle = 0 degrees<*br*>Direction = Clockwise");
} else {
c.addTitle("Start Angle = 90 degrees<*br*>Direction = AntiClockwise");
c.setStartAngle(90, False);
}
// Draw the pie in 3D
c.set3D();
// Set the pie data and the pie labels
c.setData(data, labels);
// Explode the 1st sector (index = 0)
c.setExplode(0);
// Output the chart
ret = StructNew();
ret.imageURL = c.makeSession(GetPageContext(), "chart" & chartIndex);
// Include tool tip for the chart
ret.imageMap = c.getHTMLImageMap("", "", "title='{label}: US${value}K ({percent}%)'");
return ret;
}
chart0 = createChart(0);
chart1 = createChart(1);
</cfscript>
<html>
<body style="margin:5px 0px 0px 5px">
<div style="font-size:18pt; font-family:verdana; font-weight:bold">
Start Angle and Direction
</div>
<hr style="border:solid 1px #000080" />
<cfoutput>
<div style="font-size:9pt; font-family:verdana; margin-bottom:1.5em">
<a href='viewsource.cfm?file=#CGI.SCRIPT_NAME#'>View Source Code</a>
</div>
<img src="getchart.cfm?#chart0.imageURL#" usemap="##map0" border="0" />
<map name="map0">#chart0.imageMap#</map>
<img src="getchart.cfm?#chart1.imageURL#" usemap="##map1" border="0" />
<map name="map1">#chart1.imageMap#</map>
</cfoutput>
</body>
</html> |