ChartDirector 6.0 (ColdFusion Edition)

Background and Wallpaper


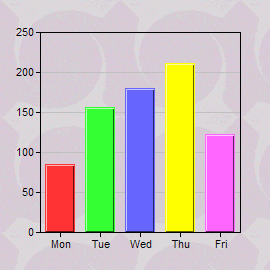
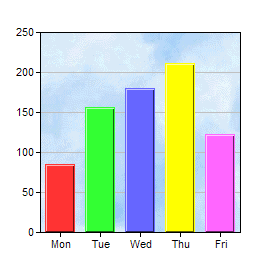
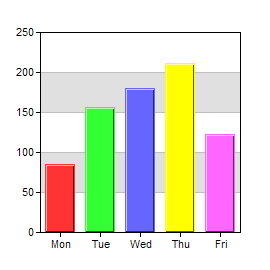
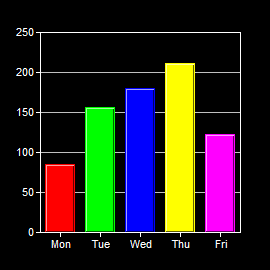
This example demonstrates some of the background effects supported by ChartDirector.

ChartDirector supports using an image file as the wallpaper of the chart image background with BaseChart.setWallpaper, and as the plot area background with PlotArea.setBackground2.

In addition to wallpapers, ChartDirector supports alternating plot area background colors using PlotArea.setBackground and PlotArea.setAltBgColor.

You can switch the default colors to using a dark background with white lines and text in one step by changing the color palette to a whiteOnBlackPalette using BaseChart.setColors.

Source Code Listing

[File: cfdemo/background.cfm]
<cfscript>

// ChartDirector for ColdFusion API Access Point
cd = CreateObject("java", "ChartDirector.CFChart");

// A utility to allow us to create arrays with data in one line of code
function Array() {
    var result = ArrayNew(1);
    var i = 0;
    for (i = 1; i LTE ArrayLen(arguments); i = i + 1)
        result[i] = arguments[i];
    return result;
}

// Function to create the demo charts
function createChart(chartIndex)
{
    // Declare local variables
    var data = 0;
    var labels = 0;
    var c = 0;
    var plotarea = 0;
    var ret = 0;

    // The data for the chart
    data = Array(85, 156, 179.5, 211, 123);
    labels = Array("Mon", "Tue", "Wed", "Thu", "Fri");

    // Create a XYChart object of size 270 x 270 pixels
    c = cd.XYChart(270, 270);

    // Set search path to current directory for loading icon images
    c.setSearchPath(GetPageContext());

    // Set the plot area at (40, 32) and of size 200 x 200 pixels
    plotarea = c.setPlotArea(40, 32, 200, 200);

    // Set the background style based on the input parameter
    if (chartIndex EQ 0) {
        // Has wallpaper image
        c.setWallpaper("tile.gif");
    } else if (chartIndex EQ 1) {
        // Use a background image as the plot area background
        plotarea.setBackground2("bg.png");
    } else if (chartIndex EQ 2) {
        // Use white (0xffffff) and grey (0xe0e0e0) as two alternate plotarea background colors
        plotarea.setBackground("0xffffff", "0xe0e0e0");
    } else {
        // Use a dark background palette
        c.setColors(cd.whiteOnBlackPalette);
    }

    // Set the labels on the x axis
    c.xAxis().setLabels(labels);

    // Add a color bar layer using the given data. Use a 1 pixel 3D border for the bars.
    c.addBarLayer3(data).setBorderColor(-1, 1);

    // Output the chart
    ret = StructNew();
    ret.imageURL = c.makeSession(GetPageContext(), "chart" & chartIndex);

    // Include tool tip for the chart
    ret.imageMap = c.getHTMLImageMap("", "", "title='Revenue for {xLabel}: US${value}K'");

    return ret;
}

chart0 = createChart(0);
chart1 = createChart(1);
chart2 = createChart(2);
chart3 = createChart(3);

</cfscript>
<html>
<body style="margin:5px 0px 0px 5px">
<div style="font-size:18pt; font-family:verdana; font-weight:bold">
    Background and Wallpaper
</div>
<hr style="border:solid 1px #000080" />
<cfoutput>
<div style="font-size:9pt; font-family:verdana; margin-bottom:1.5em">
    <a href='viewsource.cfm?file=#CGI.SCRIPT_NAME#'>View Source Code</a>
</div>
<img src="getchart.cfm?#chart0.imageURL#" usemap="##map0" border="0" />
<map name="map0">#chart0.imageMap#</map>
<img src="getchart.cfm?#chart1.imageURL#" usemap="##map1" border="0" />
<map name="map1">#chart1.imageMap#</map>
<img src="getchart.cfm?#chart2.imageURL#" usemap="##map2" border="0" />
<map name="map2">#chart2.imageMap#</map>
<img src="getchart.cfm?#chart3.imageURL#" usemap="##map3" border="0" />
<map name="map3">#chart3.imageMap#</map>
</cfoutput>
</body>
</html>