<cfscript>
// ChartDirector for ColdFusion API Access Point
cd = CreateObject("java", "ChartDirector.CFChart");
// A utility to allow us to create arrays with data in one line of code
function Array() {
var result = ArrayNew(1);
var i = 0;
for (i = 1; i LTE ArrayLen(arguments); i = i + 1)
result[i] = arguments[i];
return result;
}
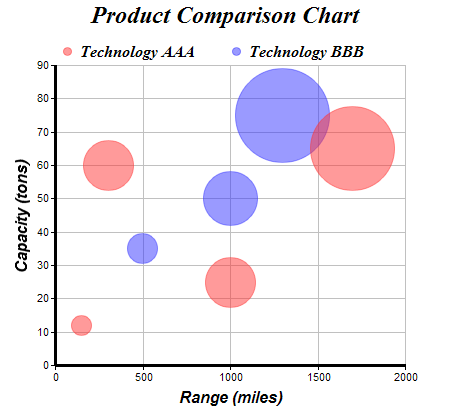
// The XYZ points for the bubble chart
dataX0 = Array(150, 300, 1000, 1700);
dataY0 = Array(12, 60, 25, 65);
dataZ0 = Array(20, 50, 50, 85);
dataX1 = Array(500, 1000, 1300);
dataY1 = Array(35, 50, 75);
dataZ1 = Array(30, 55, 95);
// Create a XYChart object of size 450 x 420 pixels
c = cd.XYChart(450, 420);
// Set the plotarea at (55, 65) and of size 350 x 300 pixels, with a light grey border (0xc0c0c0).
// Turn on both horizontal and vertical grid lines with light grey color (0xc0c0c0)
c.setPlotArea(55, 65, 350, 300, -1, -1, "0xc0c0c0", "0xc0c0c0", -1);
// Add a legend box at (50, 30) (top of the chart) with horizontal layout. Use 12pt Times Bold
// Italic font. Set the background and border color to Transparent.
c.addLegend(50, 30, False, "Times New Roman Bold Italic", 12).setBackground(cd.Transparent);
// Add a title to the chart using 18pt Times Bold Itatic font.
c.addTitle("Product Comparison Chart", "Times New Roman Bold Italic", 18);
// Add a title to the y axis using 12pt Arial Bold Italic font
c.yAxis().setTitle("Capacity (tons)", "Arial Bold Italic", 12);
// Add a title to the x axis using 12pt Arial Bold Italic font
c.xAxis().setTitle("Range (miles)", "Arial Bold Italic", 12);
// Set the axes line width to 3 pixels
c.xAxis().setWidth(3);
c.yAxis().setWidth(3);
// Add (dataX0, dataY0) as a scatter layer with semi-transparent red (0x80ff3333) circle symbols,
// where the circle size is modulated by dataZ0. This creates a bubble effect.
c.addScatterLayer(dataX0, dataY0, "Technology AAA", cd.CircleSymbol, 9, "0x80ff3333", "0x80ff3333"
).setSymbolScale(dataZ0);
// Add (dataX1, dataY1) as a scatter layer with semi-transparent green (0x803333ff) circle symbols,
// where the circle size is modulated by dataZ1. This creates a bubble effect.
c.addScatterLayer(dataX1, dataY1, "Technology BBB", cd.CircleSymbol, 9, "0x803333ff", "0x803333ff"
).setSymbolScale(dataZ1);
// Output the chart
chart1URL = c.makeSession(GetPageContext(), "chart1");
// Include tool tip for the chart
imageMap1 = c.getHTMLImageMap("", "",
"title='[{dataSetName}] Range = {x} miles, Capacity = {value} tons, Length = {z} meters'");
</cfscript>
<html>
<body style="margin:5px 0px 0px 5px">
<div style="font-size:18pt; font-family:verdana; font-weight:bold">
Bubble Chart
</div>
<hr style="border:solid 1px #000080" />
<cfoutput>
<div style="font-size:9pt; font-family:verdana; margin-bottom:1.5em">
<a href='viewsource.cfm?file=#CGI.SCRIPT_NAME#'>View Source Code</a>
</div>
<img src="getchart.cfm?#chart1URL#" usemap="##map1" border="0" />
<map name="map1">#imageMap1#</map>
</cfoutput>
</body>
</html> |