This example demonstrates loading external image files as data symbols by using DataSet.setDataSymbol2.
ChartDirector 6.0 (ColdFusion Edition)
Custom Symbols
Source Code Listing
<cfscript>
// ChartDirector for ColdFusion API Access Point
cd = CreateObject("java", "ChartDirector.CFChart");
// A utility to allow us to create arrays with data in one line of code
function Array() {
var result = ArrayNew(1);
var i = 0;
for (i = 1; i LTE ArrayLen(arguments); i = i + 1)
result[i] = arguments[i];
return result;
}
// The data for the chart
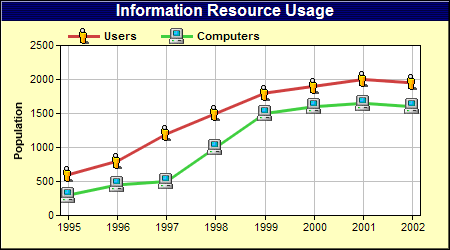
data0 = Array(600, 800, 1200, 1500, 1800, 1900, 2000, 1950);
data1 = Array(300, 450, 500, 1000, 1500, 1600, 1650, 1600);
// The labels for the chart
labels = Array("1995", "1996", "1997", "1998", "1999", "2000", "2001", "2002");
// Create a XYChart object of size 450 x 250 pixels, with a pale yellow (0xffffc0) background, a
// black border, and 1 pixel 3D border effect.
c = cd.XYChart(450, 250, "0xffffc0", 0, 1);
// Set search path to current directory for loading icon images
c.setSearchPath(GetPageContext());
// Set the plotarea at (60, 45) and of size 360 x 170 pixels, using white (0xffffff) as the plot
// area background color. Turn on both horizontal and vertical grid lines with light grey color
// (0xc0c0c0)
c.setPlotArea(60, 45, 360, 170, "0xffffff", -1, -1, "0xc0c0c0", -1);
// Add a legend box at (60, 20) (top of the chart) with horizontal layout. Use 8pt Arial Bold font.
// Set the background and border color to Transparent.
c.addLegend(60, 20, False, "Arial Bold", 8).setBackground(cd.Transparent);
// Add a title to the chart using 12pt Arial Bold/white font. Use a 1 x 2 bitmap pattern as the
// background.
c.addTitle("Information Resource Usage", "Arial Bold", 12, "0xffffff").setBackground(c.patternColor(
Array("0x000040", "0x000080"), 2));
// Set the labels on the x axis
c.xAxis().setLabels(labels);
// Reserve 8 pixels margins at both side of the x axis to avoid the first and last symbols drawing
// outside of the plot area
c.xAxis().setMargin(8, 8);
// Add a title to the y axis
c.yAxis().setTitle("Population");
// Add a line layer to the chart
layer = c.addLineLayer2();
// Add the first line using small_user.png as the symbol.
layer.addDataSet(data0, "0xcf4040", "Users").setDataSymbol2("small_user.png");
// Add the first line using small_computer.png as the symbol.
layer.addDataSet(data1, "0x40cf40", "Computers").setDataSymbol2("small_computer.png");
// Set the line width to 3 pixels
layer.setLineWidth(3);
// Output the chart
chart1URL = c.makeSession(GetPageContext(), "chart1");
// Include tool tip for the chart
imageMap1 = c.getHTMLImageMap("", "", "title='Number of {dataSetName} at {xLabel}: {value}'");
</cfscript>
<html>
<body style="margin:5px 0px 0px 5px">
<div style="font-size:18pt; font-family:verdana; font-weight:bold">
Custom Symbols
</div>
<hr style="border:solid 1px #000080" />
<cfoutput>
<div style="font-size:9pt; font-family:verdana; margin-bottom:1.5em">
<a href='viewsource.cfm?file=#CGI.SCRIPT_NAME#'>View Source Code</a>
</div>
<img src="getchart.cfm?#chart1URL#" usemap="##map1" border="0" />
<map name="map1">#imageMap1#</map>
</cfoutput>
</body>
</html> |