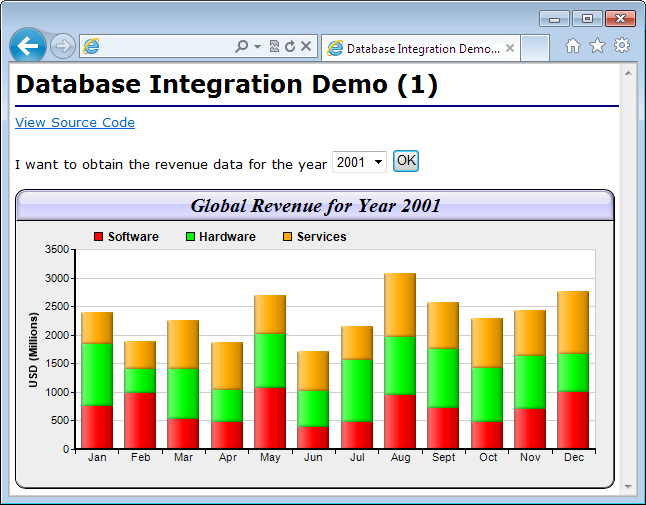
In this example, we will demonstrate how to create a web page to show the monthly revenue for a given year. The user will select a year from a drop down list box, and press OK. The web server will query a database to obtain the necessary data, and return a web page containing the bar chart for the selected year.
Note: To run this example, you need to set up the sample data source first. Please refer to "Database Sample Code Overview" for details.
[File: cfdemo/dbdemo1.cfm]
<!--- All the years in the sample database --->
<cfquery name="allYears" datasource="cdsample">
    SELECT Year(timeStamp) As Year FROM Revenue GROUP BY Year(timeStamp)
    ORDER BY Year(timeStamp)
</cfquery>

<!--- Set currently selected year as according to user input, or to the latest year
      in the database if there is no user input --->
<cfset selectedYear = IIf(IsDefined("URL.year"), "URL.year",
    allYears["Year"][ArrayLen(allYears["Year"])])>

<!--- Query data from the selected year and read them into arrays --->
<cfquery name="selectedData" datasource="cdsample">
    SELECT * FROM Revenue WHERE Year(timeStamp) = #selectedYear# Order By timeStamp
</cfquery>
<cfset software = selectedData["Software"].toArray()>
<cfset hardware = selectedData["Hardware"].toArray()>
<cfset services = selectedData["Services"].toArray()>

<cfscript>

// ChartDirector for ColdFusion API Access Point
cd = CreateObject("java", "ChartDirector.CFChart");

// A utility to allow us to create arrays with data in one line of code
function Array() {
    var result = ArrayNew(1);
    var i = 0;
    for (i = 1; i LTE ArrayLen(arguments); i = i + 1)
        result[i] = arguments[i];
    return result;
}

// Create a XYChart object of size 600 x 300 pixels, with a light grey (eeeeee) background, black
// border, 1 pixel 3D border effect and rounded corners.
c = cd.XYChart(600, 300, "0xeeeeee", "0x000000", 1);
c.setRoundedFrame();

// Set the plotarea at (60, 60) and of size 520 x 200 pixels. Set background color to white (ffffff)
// and border and grid colors to grey (cccccc)
c.setPlotArea(60, 60, 520, 200, "0xffffff", -1, "0xcccccc", "0xccccccc");

// Add a title to the chart using 15pt Times Bold Italic font, with a light blue (ccccff) background
// and with glass lighting effects.
c.addTitle("Global Revenue for Year " & selectedYear, "Times New Roman Bold Italic", 15
    ).setBackground("0xccccff", "0x000000", cd.glassEffect());

// Add a legend box at (70, 32) (top of the plotarea) with 9pt Arial Bold font
c.addLegend(70, 32, False, "Arial Bold", 9).setBackground(cd.Transparent);

// Add a stacked bar chart layer using the supplied data
layer = c.addBarLayer2(cd.Stack);
layer.addDataSet(software, "0xff0000", "Software");
layer.addDataSet(hardware, "0x00ff00", "Hardware");
layer.addDataSet(services, "0xffaa00", "Services");

// Use soft lighting effect with light direction from the left
layer.setBorderColor(cd.Transparent, cd.softLighting(cd.Left));

// Set the x axis labels. In this example, the labels must be Jan - Dec.
labels = Array("Jan", "Feb", "Mar", "Apr", "May", "Jun", "Jul", "Aug", "Sept", "Oct", "Nov", "Dec");
c.xAxis().setLabels(labels);

// Draw the ticks between label positions (instead of at label positions)
c.xAxis().setTickOffset(0.5);

// Set the y axis title
c.yAxis().setTitle("USD (Millions)");

// Set axes width to 2 pixels
c.xAxis().setWidth(2);
c.yAxis().setWidth(2);

// Output the chart in PNG format
chart1URL = c.makeSession(GetPageContext(), "chart1");

// Include tool tip for the chart
imageMap1 = c.getHTMLImageMap("", "", "title='{dataSetName} Revenue for {xLabel} = USD {value}M'");

</cfscript>

<html>
<cfoutput>
<body style="margin:5px 0px 0px 5px">
<div style="font-size:18pt; font-family:verdana; font-weight:bold">
    Database Integration Demo (1)
</div>
<hr style="border:solid 1px ##000080" />
<div style="font-size:10pt; font-family:verdana; margin-bottom:20px">
<a href='viewsource.cfm?file=#CGI.SCRIPT_NAME#'>
    View Source Code
</a>
<br />
<br />
</div>

<form>
    I want to obtain the revenue data for the year
    <select name="year"><cfloop query="allYears">
        <option value="#Year#" #IIf(Year EQ selectedYear, """Selected""", """""")#>
            #Year#
        </option>
    </cfloop></select>
    <input type="submit" value="OK">
</form>

<img src="getchart.cfm?#chart1URL#" usemap="##map1" border="0" />
<map name="map1">#imageMap1#</map>

</body>
</cfoutput>
</html> |
At the beginning of the above code are two ColdFusion database queries. The first query gets all the years in the database to fill up the drop down list box, so the user can select the year. The second query gets the data for the selected year for creating the chart. The query columns are read into array variables (using the "toArray" method) for passing to ChartDirector.
<!--- All the years in the sample database --->
<cfquery name="allYears" datasource="cdsample">
    SELECT Year(timeStamp) As Year FROM Revenue GROUP BY Year(timeStamp)
    ORDER BY Year(timeStamp)
</cfquery>

<!--- Set currently selected year as according to user input, or to the latest year
      in the database if there is no user input --->
<cfset selectedYear = IIf(IsDefined("URL.year"), "URL.year",
    allYears["Year"][ArrayLen(allYears["Year"])])>

<!--- Query data from the selected year and read them into arrays --->
<cfquery name="selectedData" datasource="cdsample">
    SELECT * FROM Revenue WHERE Year(timeStamp) = #selectedYear# Order By timeStamp
</cfquery>
<cfset software = selectedData["Software"].toArray()>
<cfset hardware = selectedData["Hardware"].toArray()>
<cfset services = selectedData["Services"].toArray()>
After we read the data into arrays, the second part of the code is to create a stacked bar chart using the given data. This is very similar to the examples in other parts of this documentation, so it will not be explained further.