<cfscript>
// ChartDirector for ColdFusion API Access Point
cd = CreateObject("java", "ChartDirector.CFChart");
// A utility to allow us to create arrays with data in one line of code
function Array() {
var result = ArrayNew(1);
var i = 0;
for (i = 1; i LTE ArrayLen(arguments); i = i + 1)
result[i] = arguments[i];
return result;
}
// The data for the bar chart
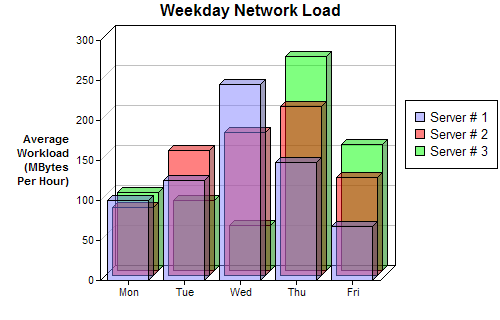
data0 = Array(100, 125, 245, 147, 67);
data1 = Array(85, 156, 179, 211, 123);
data2 = Array(97, 87, 56, 267, 157);
// The labels for the bar chart
labels = Array("Mon", "Tue", "Wed", "Thu", "Fri");
// Create a XYChart object of size 500 x 320 pixels
c = cd.XYChart(500, 320);
// Set the plotarea at (100, 40) and of size 280 x 240 pixels
c.setPlotArea(100, 40, 280, 240);
// Add a legend box at (405, 100)
c.addLegend(405, 100);
// Add a title to the chart
c.addTitle("Weekday Network Load");
// Add a title to the y axis. Draw the title upright (font angle = 0)
c.yAxis().setTitle("Average<*br*>Workload<*br*>(MBytes<*br*>Per Hour)").setFontAngle(0);
// Set the labels on the x axis
c.xAxis().setLabels(labels);
// Add three bar layers, each representing one data set. The bars are drawn in semi-transparent
// colors.
c.addBarLayer(data0, "0x808080ff", "Server ## 1", 5);
c.addBarLayer(data1, "0x80ff0000", "Server ## 2", 5);
c.addBarLayer(data2, "0x8000ff00", "Server ## 3", 5);
// Output the chart
chart1URL = c.makeSession(GetPageContext(), "chart1");
// Include tool tip for the chart
imageMap1 = c.getHTMLImageMap("", "", "title='{dataSetName} on {xLabel}: {value} MBytes/hour'");
</cfscript>
<html>
<body style="margin:5px 0px 0px 5px">
<div style="font-size:18pt; font-family:verdana; font-weight:bold">
Depth Bar Chart
</div>
<hr style="border:solid 1px #000080" />
<cfoutput>
<div style="font-size:9pt; font-family:verdana; margin-bottom:1.5em">
<a href='viewsource.cfm?file=#CGI.SCRIPT_NAME#'>View Source Code</a>
</div>
<img src="getchart.cfm?#chart1URL#" usemap="##map1" border="0" />
<map name="map1">#imageMap1#</map>
</cfoutput>
</body>
</html> |