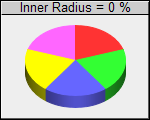
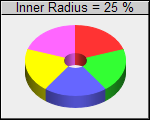
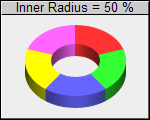
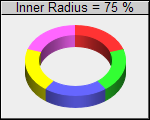
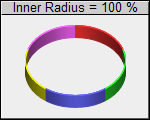
This example demonstrates the effects of different donut widths.
Donut widths are configured by using different inner and outer radii when calling PieChart.setDonutSize.
ChartDirector 6.0 (ColdFusion Edition)
Donut Width
Source Code Listing
<cfscript>

// ChartDirector for ColdFusion API Access Point
cd = CreateObject("java", "ChartDirector.CFChart");

// A utility to allow us to create arrays with data in one line of code
function Array() {
    var result = ArrayNew(1);
    var i = 0;
    for (i = 1; i LTE ArrayLen(arguments); i = i + 1)
        result[i] = arguments[i];
    return result;
}

// Function to create the demo charts
function createChart(chartIndex)
{
    // Declare local variables
    var donutRadius = 0;
    var data = 0;
    var labels = 0;
    var c = 0;
    var ret = 0;

    // Determine the donut inner radius (as percentage of outer radius) based on input parameter
    donutRadius = chartIndex * 25;

    // The data for the pie chart
    data = Array(10, 10, 10, 10, 10);

    // The labels for the pie chart
    labels = Array("Marble", "Wood", "Granite", "Plastic", "Metal");

    // Create a PieChart object of size 150 x 120 pixels, with a grey (EEEEEE) background, black
    // border and 1 pixel 3D border effect
    c = cd.PieChart(150, 120, "0xeeeeee", "0x000000", 1);

    // Set donut center at (75, 65) and the outer radius to 50 pixels. Inner radius is computed
    // according donutWidth
    c.setDonutSize(75, 60, 50, Int(50 * donutRadius / 100));

    // Add a title to show the donut width
    c.addTitle("Inner Radius = " & donutRadius & " %", "Arial", 10).setBackground("0xcccccc", 0);

    // Draw the pie in 3D
    c.set3D(12);

    // Set the pie data and the pie labels
    c.setData(data, labels);

    // Disable the sector labels by setting the color to Transparent
    c.setLabelStyle("", 8, cd.Transparent);

    // Output the chart
    ret = StructNew();
    ret.imageURL = c.makeSession(GetPageContext(), "chart" & chartIndex);

    // Include tool tip for the chart
    ret.imageMap = c.getHTMLImageMap("", "", "title='{label}: {value}kg ({percent}%)'");

    return ret;
}

chart0 = createChart(0);
chart1 = createChart(1);
chart2 = createChart(2);
chart3 = createChart(3);
chart4 = createChart(4);

</cfscript>
<html>
<body style="margin:5px 0px 0px 5px">
<div style="font-size:18pt; font-family:verdana; font-weight:bold">
    Donut Width
</div>
<hr style="border:solid 1px #000080" />
<cfoutput>
<div style="font-size:9pt; font-family:verdana; margin-bottom:1.5em">
    <a href='viewsource.cfm?file=#CGI.SCRIPT_NAME#'>View Source Code</a>
</div>
<img src="getchart.cfm?#chart0.imageURL#" usemap="##map0" border="0" />
<map name="map0">#chart0.imageMap#</map>
<img src="getchart.cfm?#chart1.imageURL#" usemap="##map1" border="0" />
<map name="map1">#chart1.imageMap#</map>
<img src="getchart.cfm?#chart2.imageURL#" usemap="##map2" border="0" />
<map name="map2">#chart2.imageMap#</map>
<img src="getchart.cfm?#chart3.imageURL#" usemap="##map3" border="0" />
<map name="map3">#chart3.imageMap#</map>
<img src="getchart.cfm?#chart4.imageURL#" usemap="##map4" border="0" />
<map name="map4">#chart4.imageMap#</map>
</cfoutput>
</body>
</html> |