<cfscript>
// ChartDirector for ColdFusion API Access Point
cd = CreateObject("java", "ChartDirector.CFChart");
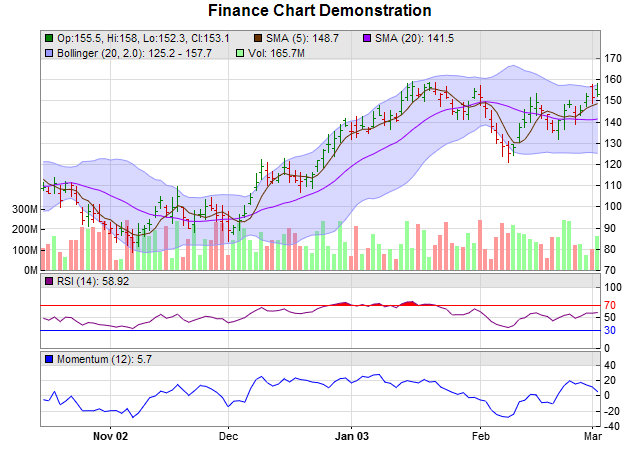
// Create a finance chart demo containing 100 days of data
noOfDays = 100;
// To compute moving averages starting from the first day, we need to get extra data points before
// the first day
extraDays = 30;
// In this exammple, we use a random number generator utility to simulate the data. We set up the
// random table to create 6 cols x (noOfDays + extraDays) rows, using 9 as the seed.
rantable = cd.RanTable(9, 6, noOfDays + extraDays);
// Set the 1st col to be the timeStamp, starting from Sep 4, 2002, with each row representing one
// day, and counting week days only (jump over Sat and Sun)
rantable.setDateCol(0, CreateDate(2002, 9, 4), 86400, True);
// Set the 2nd, 3rd, 4th and 5th columns to be high, low, open and close data. The open value starts
// from 100, and the daily change is random from -5 to 5.
rantable.setHLOCCols(1, 100, -5, 5);
// Set the 6th column as the vol data from 5 to 25 million
rantable.setCol(5, 50000000, 250000000);
// Now we read the data from the table into arrays
timeStamps = rantable.getCol(0);
highData = rantable.getCol(1);
lowData = rantable.getCol(2);
openData = rantable.getCol(3);
closeData = rantable.getCol(4);
volData = rantable.getCol(5);
// Create a FinanceChart object of width 640 pixels
c = cd.FinanceChart(640);
// Add a title to the chart
c.addTitle("Finance Chart Demonstration");
// Set the data into the finance chart object
c.setData(timeStamps, highData, lowData, openData, closeData, volData, extraDays);
// Add the main chart with 240 pixels in height
c.addMainChart(240);
// Add a 5 period simple moving average to the main chart, using brown color
c.addSimpleMovingAvg(5, "0x663300");
// Add a 20 period simple moving average to the main chart, using purple color
c.addSimpleMovingAvg(20, "0x9900ff");
// Add HLOC symbols to the main chart, using green/red for up/down days
c.addHLOC("0x008000", "0xcc0000");
// Add 20 days bollinger band to the main chart, using light blue (9999ff) as the border and
// semi-transparent blue (c06666ff) as the fill color
c.addBollingerBand(20, 2, "0x9999ff", "0xc06666ff");
// Add a 75 pixels volume bars sub-chart to the bottom of the main chart, using green/red/grey for
// up/down/flat days
c.addVolBars(75, "0x99ff99", "0xff9999", "0x808080");
// Append a 14-days RSI indicator chart (75 pixels high) after the main chart. The main RSI line is
// purple (800080). Set threshold region to +/- 20 (that is, RSI = 50 +/- 25). The upper/lower
// threshold regions will be filled with red (ff0000)/blue (0000ff).
c.addRSI(75, 14, "0x800080", 20, "0xff0000", "0x0000ff");
// Append a 12-days momentum indicator chart (75 pixels high) using blue (0000ff) color.
c.addMomentum(75, 12, "0x0000ff");
// Output the chart
chart1URL = c.makeSession(GetPageContext(), "chart1");
</cfscript>
<html>
<body style="margin:5px 0px 0px 5px">
<div style="font-size:18pt; font-family:verdana; font-weight:bold">
Finance Chart (1)
</div>
<hr style="border:solid 1px #000080" />
<cfoutput>
<div style="font-size:9pt; font-family:verdana; margin-bottom:1.5em">
<a href='viewsource.cfm?file=#CGI.SCRIPT_NAME#'>View Source Code</a>
</div>
<img src="getchart.cfm?#chart1URL#" />
</cfoutput>
</body>
</html> |