<cfscript>
// ChartDirector for ColdFusion API Access Point
cd = CreateObject("java", "ChartDirector.CFChart");
// A utility to allow us to create arrays with data in one line of code
function Array() {
var result = ArrayNew(1);
var i = 0;
for (i = 1; i LTE ArrayLen(arguments); i = i + 1)
result[i] = arguments[i];
return result;
}
//
// Sample data for the HLOC chart.
//
highData = Array(2043, 2039, 2076, 2064, 2048, 2058, 2070, 2033, 2027, 2029, 2071, 2085, 2034, 2031,
2056, 2128, 2180, 2183, 2192, 2213, 2230, 2281, 2272);
lowData = Array(1931, 1921, 1985, 2028, 1986, 1994, 1999, 1958, 1943, 1944, 1962, 2011, 1975, 1962,
1928, 2059, 2112, 2103, 2151, 2127, 2123, 2152, 2212);
openData = Array(2000, 1957, 1993, 2037, 2018, 2021, 2045, 2009, 1959, 1985, 2008, 2048, 2006, 2010,
1971, 2080, 2116, 2137, 2170, 2172, 2171, 2191, 2240);
closeData = Array(1950, 1991, 2026, 2029, 2004, 2053, 2011, 1962, 1987, 2019, 2040, 2016, 1996,
1985, 2006, 2113, 2142, 2167, 2158, 2201, 2188, 2231, 2242);
// The labels for the HLOC chart
labels = Array("Mon 1", "Tue 2", "Wed 3", "Thu 4", "Fri 5", "Mon 8", "Tue 9", "Wed 10", "Thu 11",
"Fri 12", "Mon 15", "Tue 16", "Wed 17", "Thu 18", "Fri 19", "Mon 22", "Tue 23", "Wed 24",
"Thu 25", "Fri 26", "Mon 29", "Tue 30", "Wed 31");
// Create a XYChart object of size 600 x 350 pixels
c = cd.XYChart(600, 350);
// Set the plotarea at (50, 25) and of size 500 x 250 pixels. Enable both the horizontal and
// vertical grids by setting their colors to grey (0xc0c0c0)
c.setPlotArea(50, 25, 500, 250).setGridColor("0xc0c0c0", "0xc0c0c0");
// Add a title to the chart
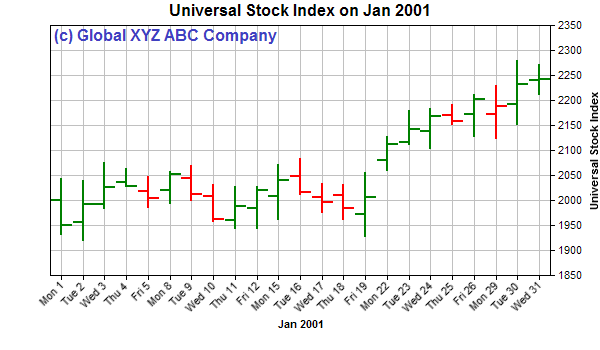
c.addTitle("Universal Stock Index on Jan 2001");
// Add a custom text at (50, 25) (the upper left corner of the plotarea). Use 12pt Arial Bold/blue
// (4040c0) as the font.
c.addText(50, 25, "(c) Global XYZ ABC Company", "Arial Bold", 12, "0x4040c0");
// Add a title to the x axis
c.xAxis().setTitle("Jan 2001");
// Set the labels on the x axis. Rotate the labels by 45 degrees.
c.xAxis().setLabels(labels).setFontAngle(45);
// Add a title to the y axis
c.yAxis().setTitle("Universal Stock Index");
// Draw the y axis on the right hand side of the plot area
c.setYAxisOnRight(True);
// Add a HLOC layer to the chart using green (008000) for up days and red (ff0000) for down days
layer = c.addHLOCLayer3(highData, lowData, openData, closeData, "0x008000", "0xff0000");
// Set the line width to 2 pixels
layer.setLineWidth(2);
// Output the chart
chart1URL = c.makeSession(GetPageContext(), "chart1");
// Include tool tip for the chart
imageMap1 = c.getHTMLImageMap("", "",
"title='{xLabel} Jan 2001<*br*>High:{high}<*br*>Open:{open}<*br*>Close:{close}<*br*>Low:{low}'")
;
</cfscript>
<html>
<body style="margin:5px 0px 0px 5px">
<div style="font-size:18pt; font-family:verdana; font-weight:bold">
Simple HLOC Chart
</div>
<hr style="border:solid 1px #000080" />
<cfoutput>
<div style="font-size:9pt; font-family:verdana; margin-bottom:1.5em">
<a href='viewsource.cfm?file=#CGI.SCRIPT_NAME#'>View Source Code</a>
</div>
<img src="getchart.cfm?#chart1URL#" usemap="##map1" border="0" />
<map name="map1">#imageMap1#</map>
</cfoutput>
</body>
</html> |