<cfscript>
// ChartDirector for ColdFusion API Access Point
cd = CreateObject("java", "ChartDirector.CFChart");
// A utility to allow us to create arrays with data in one line of code
function Array() {
var result = ArrayNew(1);
var i = 0;
for (i = 1; i LTE ArrayLen(arguments); i = i + 1)
result[i] = arguments[i];
return result;
}
// The data for the upper and lower bounding lines
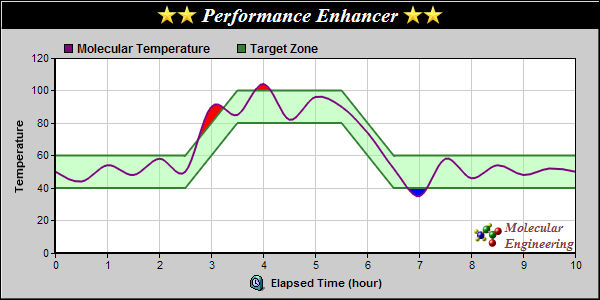
upperY = Array(60, 60, 100, 100, 60, 60);
lowerY = Array(40, 40, 80, 80, 40, 40);
zoneX = Array(0, 2.5, 3.5, 5.5, 6.5, 10);
// The data for the spline curve
curveY = Array(50, 44, 54, 48, 58, 50, 90, 85, 104, 82, 96, 90, 74, 52, 35, 58, 46, 54, 48, 52, 50);
curveX = Array(0, 0.5, 1, 1.5, 2, 2.5, 3, 3.5, 4, 4.5, 5, 5.5, 6, 6.5, 7, 7.5, 8, 8.5, 9, 9.5, 10);
// Create a XYChart object of size 600 x 300 pixels, with a light grey (cccccc) background, black
// border, and 1 pixel 3D border effect.
c = cd.XYChart(600, 300, "0xcccccc", "0x000000", 1);
// Set search path to current directory for loading icon images
c.setSearchPath(GetPageContext());
// Set the plotarea at (55, 58) and of size 520 x 195 pixels, with white background. Turn on both
// horizontal and vertical grid lines with light grey color (cccccc)
c.setPlotArea(55, 58, 520, 195, "0xffffff", -1, -1, "0xcccccc", "0xcccccc");
// Add a legend box at (55, 32) (top of the chart) with horizontal layout. Use 9pt Arial Bold font.
// Set the background and border color to Transparent.
c.addLegend(55, 32, False, "Arial Bold", 9).setBackground(cd.Transparent);
// Add a title box to the chart using 15pt Times Bold Italic font. The title is in CDML and includes
// embedded images for highlight. The text is white (ffffff) on a black background, with a 1 pixel
// 3D border.
c.addTitle(
"<*block,valign=absmiddle*><*img=star.png*><*img=star.png*> Performance Enhancer " &
"<*img=star.png*><*img=star.png*><*/*>", "Times New Roman Bold Italic", 15, "0xffffff"
).setBackground("0x000000", -1, 1);
// Add a title to the y axis
c.yAxis().setTitle("Temperature");
// Add a title to the x axis using CMDL
c.xAxis().setTitle("<*block,valign=absmiddle*><*img=clock.png*> Elapsed Time (hour)<*/*>");
// Set the axes width to 2 pixels
c.xAxis().setWidth(2);
c.yAxis().setWidth(2);
// Add a purple (800080) spline layer to the chart with a line width of 2 pixels
splineLayer = c.addSplineLayer(curveY, "0x800080", "Molecular Temperature");
splineLayer.setXData(curveX);
splineLayer.setLineWidth(2);
// Add a line layer to the chart with two dark green (338033) data sets, and a line width of 2
// pixels
lineLayer = c.addLineLayer2();
lineLayer.addDataSet(upperY, "0x338033", "Target Zone");
lineLayer.addDataSet(lowerY, "0x338033");
lineLayer.setXData(zoneX);
lineLayer.setLineWidth(2);
// Color the zone between the upper zone line and lower zone line as semi-transparent light green
// (8099ff99)
c.addInterLineLayer(lineLayer.getLine(0), lineLayer.getLine(1), "0x8099ff99", "0x8099ff99");
// If the spline line gets above the upper zone line, color to area between the lines red (ff0000)
c.addInterLineLayer(splineLayer.getLine(0), lineLayer.getLine(0), "0xff0000", cd.Transparent);
// If the spline line gets below the lower zone line, color to area between the lines blue (0000ff)
c.addInterLineLayer(splineLayer.getLine(0), lineLayer.getLine(1), cd.Transparent, "0x0000ff");
// Add a custom CDML text at the bottom right of the plot area as the logo
c.addText(575, 250,
"<*block,valign=absmiddle*><*img=small_molecule.png*> <*block*><*font=Times New Roman Bold " &
"Italic,size=10,color=804040*>Molecular<*br*>Engineering<*/*>").setAlignment(cd.BottomRight);
// Output the chart
chart1URL = c.makeSession(GetPageContext(), "chart1");
// Include tool tip for the chart
imageMap1 = c.getHTMLImageMap("", "", "title='Temperature at hour {x}: {value} C'");
</cfscript>
<html>
<body style="margin:5px 0px 0px 5px">
<div style="font-size:18pt; font-family:verdana; font-weight:bold">
Line with Target Zone
</div>
<hr style="border:solid 1px #000080" />
<cfoutput>
<div style="font-size:9pt; font-family:verdana; margin-bottom:1.5em">
<a href='viewsource.cfm?file=#CGI.SCRIPT_NAME#'>View Source Code</a>
</div>
<img src="getchart.cfm?#chart1URL#" usemap="##map1" border="0" />
<map name="map1">#imageMap1#</map>
</cfoutput>
</body>
</html> |