<cfscript>
// ChartDirector for ColdFusion API Access Point
cd = CreateObject("java", "ChartDirector.CFChart");
// A utility to allow us to create arrays with data in one line of code
function Array() {
var result = ArrayNew(1);
var i = 0;
for (i = 1; i LTE ArrayLen(arguments); i = i + 1)
result[i] = arguments[i];
return result;
}
// The data for the bar chart
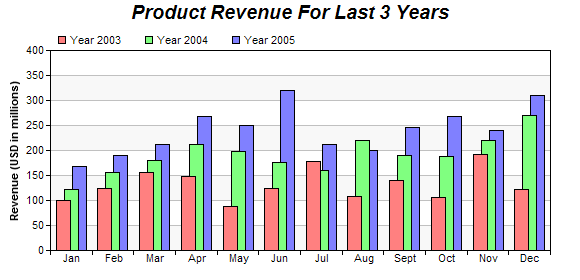
data0 = Array(100, 125, 156, 147, 87, 124, 178, 109, 140, 106, 192, 122);
data1 = Array(122, 156, 179, 211, 198, 177, 160, 220, 190, 188, 220, 270);
data2 = Array(167, 190, 213, 267, 250, 320, 212, 199, 245, 267, 240, 310);
labels = Array("Jan", "Feb", "Mar", "Apr", "May", "Jun", "Jul", "Aug", "Sept", "Oct", "Nov", "Dec");
// Create a XYChart object of size 580 x 280 pixels
c = cd.XYChart(580, 280);
// Add a title to the chart using 14pt Arial Bold Italic font
c.addTitle("Product Revenue For Last 3 Years", "Arial Bold Italic", 14);
// Set the plot area at (50, 50) and of size 500 x 200. Use two alternative background colors
// (f8f8f8 and ffffff)
c.setPlotArea(50, 50, 500, 200, "0xf8f8f8", "0xffffff");
// Add a legend box at (50, 25) using horizontal layout. Use 8pt Arial as font, with transparent
// background.
c.addLegend(50, 25, False, "Arial", 8).setBackground(cd.Transparent);
// Set the x axis labels
c.xAxis().setLabels(labels);
// Draw the ticks between label positions (instead of at label positions)
c.xAxis().setTickOffset(0.5);
// Add a multi-bar layer with 3 data sets
layer = c.addBarLayer2(cd.Side);
layer.addDataSet(data0, "0xff8080", "Year 2003");
layer.addDataSet(data1, "0x80ff80", "Year 2004");
layer.addDataSet(data2, "0x8080ff", "Year 2005");
// Set 50% overlap between bars
layer.setOverlapRatio(0.5);
// Add a title to the y-axis
c.yAxis().setTitle("Revenue (USD in millions)");
// Output the chart
chart1URL = c.makeSession(GetPageContext(), "chart1");
// Include tool tip for the chart
imageMap1 = c.getHTMLImageMap("", "", "title='{xLabel} Revenue on {dataSetName}: {value} millions'")
;
</cfscript>
<html>
<body style="margin:5px 0px 0px 5px">
<div style="font-size:18pt; font-family:verdana; font-weight:bold">
Overlapping Bar Chart
</div>
<hr style="border:solid 1px #000080" />
<cfoutput>
<div style="font-size:9pt; font-family:verdana; margin-bottom:1.5em">
<a href='viewsource.cfm?file=#CGI.SCRIPT_NAME#'>View Source Code</a>
</div>
<img src="getchart.cfm?#chart1URL#" usemap="##map1" border="0" />
<map name="map1">#imageMap1#</map>
</cfoutput>
</body>
</html> |