<cfscript>
// ChartDirector for ColdFusion API Access Point
cd = CreateObject("java", "ChartDirector.CFChart");
// A utility to allow us to create arrays with data in one line of code
function Array() {
var result = ArrayNew(1);
var i = 0;
for (i = 1; i LTE ArrayLen(arguments); i = i + 1)
result[i] = arguments[i];
return result;
}
// Coordinates of the starting points of the vectors
radius = Array(5, 5, 5, 5, 5, 5, 5, 5, 5, 5, 5, 5, 10, 10, 10, 10, 10, 10, 10, 10, 10, 10, 10, 10,
15, 15, 15, 15, 15, 15, 15, 15, 15, 15, 15, 15, 20, 20, 20, 20, 20, 20, 20, 20, 20, 20, 20, 20,
25, 25, 25, 25, 25, 25, 25, 25, 25, 25, 25, 25);
angle = Array(0, 30, 60, 90, 120, 150, 180, 210, 240, 270, 300, 330, 0, 30, 60, 90, 120, 150, 180,
210, 240, 270, 300, 330, 0, 30, 60, 90, 120, 150, 180, 210, 240, 270, 300, 330, 0, 30, 60, 90,
120, 150, 180, 210, 240, 270, 300, 330, 0, 30, 60, 90, 120, 150, 180, 210, 240, 270, 300, 330);
// Magnitude and direction of the vectors
magnitude = Array(5, 5, 5, 5, 5, 5, 5, 5, 5, 5, 5, 5, 4, 4, 4, 4, 4, 4, 4, 4, 4, 4, 4, 4, 3, 3, 3,
3, 3, 3, 3, 3, 3, 3, 3, 3, 2, 2, 2, 2, 2, 2, 2, 2, 2, 2, 2, 2, 1, 1, 1, 1, 1, 1, 1, 1, 1, 1, 1,
1);
direction = Array(60, 90, 120, 150, 180, 210, 240, 270, 300, 330, 0, 30, 60, 90, 120, 150, 180, 210,
240, 270, 300, 330, 0, 30, 60, 90, 120, 150, 180, 210, 240, 270, 300, 330, 0, 30, 60, 90, 120,
150, 180, 210, 240, 270, 300, 330, 0, 30, 60, 90, 120, 150, 180, 210, 240, 270, 300, 330, 0, 30)
;
// Create a PolarChart object of size 460 x 460 pixels
c = cd.PolarChart(460, 460);
// Add a title to the chart at the top left corner using 15pt Arial Bold Italic font
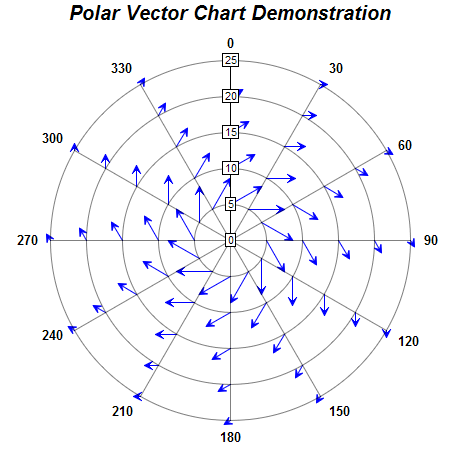
c.addTitle("Polar Vector Chart Demonstration", "Arial Bold Italic", 15);
// Set center of plot area at (230, 240) with radius 180 pixels
c.setPlotArea(230, 240, 180);
// Set the grid style to circular grid
c.setGridStyle(False);
// Set angular axis as 0 - 360, with a spoke every 30 units
c.angularAxis().setLinearScale(0, 360, 30);
// Add a polar vector layer to the chart with blue (0000ff) vectors
c.addVectorLayer(radius, angle, magnitude, direction, cd.RadialAxisScale, "0x0000ff");
// Output the chart
chart1URL = c.makeSession(GetPageContext(), "chart1");
// Include tool tip for the chart
imageMap1 = c.getHTMLImageMap("", "",
"title='Vector at ({value}, {angle} deg): Length = {len}, Angle = {dir} deg'");
</cfscript>
<html>
<body style="margin:5px 0px 0px 5px">
<div style="font-size:18pt; font-family:verdana; font-weight:bold">
Polar Vector Chart
</div>
<hr style="border:solid 1px #000080" />
<cfoutput>
<div style="font-size:9pt; font-family:verdana; margin-bottom:1.5em">
<a href='viewsource.cfm?file=#CGI.SCRIPT_NAME#'>View Source Code</a>
</div>
<img src="getchart.cfm?#chart1URL#" usemap="##map1" border="0" />
<map name="map1">#imageMap1#</map>
</cfoutput>
</body>
</html> |