<cfscript>
// ChartDirector for ColdFusion API Access Point
cd = CreateObject("java", "ChartDirector.CFChart");
// A utility to allow us to create arrays with data in one line of code
function Array() {
var result = ArrayNew(1);
var i = 0;
for (i = 1; i LTE ArrayLen(arguments); i = i + 1)
result[i] = arguments[i];
return result;
}
// The data for the chart
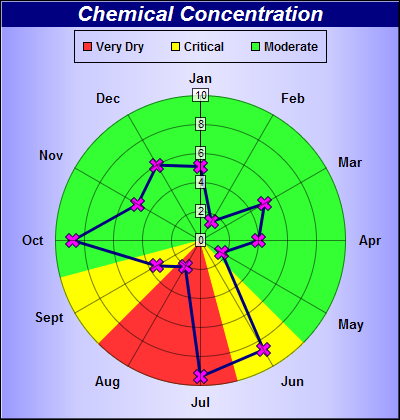
data = Array(5.1, 1.5, 5.1, 4.0, 1.7, 8.7, 9.4, 2.1, 3.5, 8.8, 5.0, 6.0);
// The labels for the chart
labels = Array("Jan", "Feb", "Mar", "Apr", "May", "Jun", "Jul", "Aug", "Sept", "Oct", "Nov", "Dec");
// Create a PolarChart object of size 400 x 420 pixels. with a metallic blue (9999ff) background
// color and 1 pixel 3D border
c = cd.PolarChart(400, 420, cd.metalColor("0x9999ff"), "0x000000", 1);
// Add a title to the chart using 16pt Arial Bold Italic font. The title text is white (0xffffff) on
// deep blue (000080) background
c.addTitle("Chemical Concentration", "Arial Bold Italic", 16, "0xffffff").setBackground("0x000080");
// Set center of plot area at (200, 240) with radius 145 pixels. Set background color to green
// (0x33ff33)
c.setPlotArea(200, 240, 145, "0x33ff33");
// Set the labels to the angular axis
c.angularAxis().setLabels(labels);
// Color the sector between label index = 5.5 to 7.5 as red (ff3333) zone
c.angularAxis().addZone(5.5, 7.5, "0xff3333");
// Color the sector between label index = 4.5 to 5.5, and also between 7.5 to 8.5, as yellow
// (ff3333) zones
c.angularAxis().addZone(4.5, 5.5, "0xffff00");
c.angularAxis().addZone(7.5, 8.5, "0xffff00");
// Set the grid style to circular grid
c.setGridStyle(False);
// Use semi-transparent (40ffffff) label background so as not to block the data
c.radialAxis().setLabelStyle().setBackground("0x40ffffff", "0x40000000");
// Add a legend box at (200, 30) top center aligned, using 9pt Arial Bold font. with a black border.
legendBox = c.addLegend(200, 30, False, "Arial Bold", 9);
legendBox.setAlignment(cd.TopCenter);
// Add legend keys to represent the red/yellow/green zones
legendBox.addKey("Very Dry", "0xff3333");
legendBox.addKey("Critical", "0xffff00");
legendBox.addKey("Moderate", "0x33ff33");
// Add a blue (0x80) line layer with line width set to 3 pixels and use purple (ff00ff) cross
// symbols for the data points
layer = c.addLineLayer(data, "0x000080");
layer.setLineWidth(3);
layer.setDataSymbol(cd.Cross2Shape(), 15, "0xff00ff");
// Output the chart
chart1URL = c.makeSession(GetPageContext(), "chart1");
// Include tool tip for the chart.
imageMap1 = layer.getHTMLImageMap("", "", "title='Concentration on {label}: {value} ppm'");
</cfscript>
<html>
<body style="margin:5px 0px 0px 5px">
<div style="font-size:18pt; font-family:verdana; font-weight:bold">
Sector Zones
</div>
<hr style="border:solid 1px #000080" />
<cfoutput>
<div style="font-size:9pt; font-family:verdana; margin-bottom:1.5em">
<a href='viewsource.cfm?file=#CGI.SCRIPT_NAME#'>View Source Code</a>
</div>
<img src="getchart.cfm?#chart1URL#" usemap="##map1" border="0" />
<map name="map1">#imageMap1#</map>
</cfoutput>
</body>
</html> |