<cfscript>
// ChartDirector for ColdFusion API Access Point
cd = CreateObject("java", "ChartDirector.CFChart");
// A utility to allow us to create arrays with data in one line of code
function Array() {
var result = ArrayNew(1);
var i = 0;
for (i = 1; i LTE ArrayLen(arguments); i = i + 1)
result[i] = arguments[i];
return result;
}
//
// We use a random table to simulate generating 12 months of data
//
// Create the random table object with 4 cols * 12 rows, using 3 as seed
rantable = cd.RanTable(3, 4, 12);
// Set the 1st column to be the 12 months of year 2002
rantable.setDateCol(0, CreateDate(2002, 1, 1), 86400 * 30);
// Set the 2nd, 3rd and 4th columns to be random numbers starting from 125, 75, and 100
// respectively. The change between rows is set to -35 to + 35. The minimum value of any cell is 0.
rantable.setCol(1, 125, -35, 35, 0);
rantable.setCol(2, 75, -35, 35, 0);
rantable.setCol(3, 100, -35, 35, 0);
// Get the 1st column (time) as the x data
dataX = rantable.getCol(0);
// Get the 2nd, 3rd and 4th columns as 3 data sets
dataY0 = rantable.getCol(1);
dataY1 = rantable.getCol(2);
dataY2 = rantable.getCol(3);
// Create a XYChart object of size 360 x 400 pixels
c = cd.XYChart(360, 400);
// Add a title to the chart
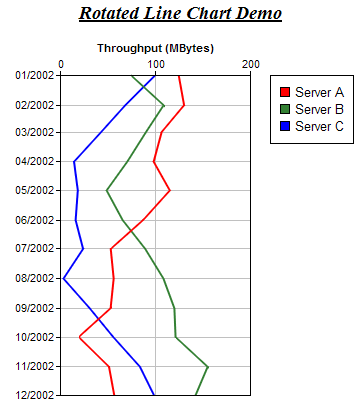
c.addTitle("<*underline=2*>Rotated Line Chart Demo", "Times New Roman Bold Italic", 14);
// Set the plotarea at (60, 75) and of size 190 x 320 pixels. Turn on both horizontal and vertical
// grid lines with light grey color (0xc0c0c0)
c.setPlotArea(60, 75, 190, 320).setGridColor("0xc0c0c0", "0xc0c0c0");
// Add a legend box at (270, 75)
c.addLegend(270, 75);
// Swap the x and y axis to become a rotated chart
c.swapXY();
// Set the y axis on the top side (right + rotated = top)
c.setYAxisOnRight();
// Add a title to the y axis
c.yAxis().setTitle("Throughput (MBytes)");
// Reverse the x axis so it is pointing downwards
c.xAxis().setReverse();
// Add a line chart layer using the given data
layer = c.addLineLayer2();
layer.setXData(dataX);
layer.addDataSet(dataY0, "0xff0000", "Server A");
layer.addDataSet(dataY1, "0x338033", "Server B");
layer.addDataSet(dataY2, "0x0000ff", "Server C");
// Set the line width to 2 pixels
layer.setLineWidth(2);
// Output the chart
chart1URL = c.makeSession(GetPageContext(), "chart1");
// Include tool tip for the chart
imageMap1 = c.getHTMLImageMap("", "", "title='[{dataSetName}] {x|mm/yyyy}: {value|0} MByte'");
</cfscript>
<html>
<body style="margin:5px 0px 0px 5px">
<div style="font-size:18pt; font-family:verdana; font-weight:bold">
Rotated Line Chart
</div>
<hr style="border:solid 1px #000080" />
<cfoutput>
<div style="font-size:9pt; font-family:verdana; margin-bottom:1.5em">
<a href='viewsource.cfm?file=#CGI.SCRIPT_NAME#'>View Source Code</a>
</div>
<img src="getchart.cfm?#chart1URL#" usemap="##map1" border="0" />
<map name="map1">#imageMap1#</map>
</cfoutput>
</body>
</html> |