<cfscript>
// ChartDirector for ColdFusion API Access Point
cd = CreateObject("java", "ChartDirector.CFChart");
// A utility to allow us to create arrays with data in one line of code
function Array() {
var result = ArrayNew(1);
var i = 0;
for (i = 1; i LTE ArrayLen(arguments); i = i + 1)
result[i] = arguments[i];
return result;
}
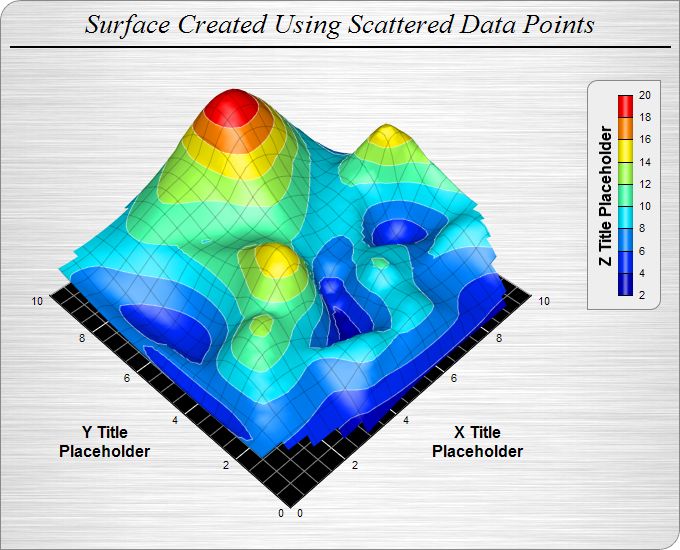
// The (x, y, z) coordinates of the scattered data
dataX = Array(0.5, 1.9, 4.9, 1.0, 8.9, 9.8, 5.9, 2.9, 6.8, 9.0, 0.0, 8.9, 1.9, 4.8, 2.4, 3.4, 7.9,
7.5, 4.8, 7.5, 9.5, 0.4, 8.9, 0.9, 5.4, 9.4, 2.9, 8.9, 0.9, 8.9, 10.0, 1.0, 6.8, 3.8, 9.0, 5.3,
6.4, 4.9, 4.5, 2.0, 5.4, 0.0, 10.0, 3.9, 5.4, 5.9, 5.8, 0.3, 4.4, 8.3);
dataY = Array(3.3, 3.0, 0.7, 1.0, 9.3, 4.5, 8.4, 0.1, 0.8, 0.1, 9.3, 1.8, 4.3, 1.3, 2.3, 5.4, 6.9,
9.0, 9.8, 7.5, 1.8, 1.4, 4.5, 7.8, 3.8, 4.0, 2.9, 2.4, 3.9, 2.9, 2.3, 9.3, 2.0, 3.4, 4.8, 2.3,
3.4, 2.3, 1.5, 7.8, 4.5, 0.9, 6.3, 2.4, 6.9, 2.8, 1.3, 2.9, 6.4, 6.3);
dataZ = Array(6.6, 12.5, 7.4, 6.2, 9.6, 13.6, 19.9, 2.2, 6.9, 3.4, 8.7, 8.4, 7.8, 8.0, 9.4, 11.9,
9.6, 15.7, 12.0, 13.3, 9.6, 6.4, 9.0, 6.9, 4.6, 9.7, 10.6, 9.2, 7.0, 6.9, 9.7, 8.6, 8.0, 13.6,
13.2, 5.9, 9.0, 3.2, 8.3, 9.7, 8.2, 6.1, 8.7, 5.6, 14.9, 9.8, 9.3, 5.1, 10.8, 9.8);
// Create a SurfaceChart object of size 680 x 550 pixels. Set background to brushed silver and
// border to grey (888888). Set the top-left and bottom-right corners to rounded corners with 20
// pixels radius.
c = cd.SurfaceChart(680, 550, cd.brushedSilverColor(), "0x888888");
c.setRoundedFrame("0xffffff", 20, 0, 20, 0);
// Add a title to the chart using 20 points Times New Roman Italic font. Set top/bottom margin to 8
// pixels.
title = c.addTitle("Surface Created Using Scattered Data Points", "Times New Roman Italic", 20);
title.setMargin2(0, 0, 8, 8);
// Add a 2 pixel wide black (000000) separator line under the title
c.addLine(10, title.getHeight(), c.getWidth() - 10, title.getHeight(), "0x000000", 2);
// Set the center of the plot region at (290, 235), and set width x depth x height to 360 x 360 x
// 180 pixels
c.setPlotRegion(290, 235, 360, 360, 180);
// Set the elevation and rotation angles to 45 and -45 degrees
c.setViewAngle(45, -45);
// Set the perspective level to 30
c.setPerspective(30);
// Set the data to use to plot the chart
c.setData(dataX, dataY, dataZ);
// Add a color axis (the legend) in which the top right corner is anchored at (660, 80). Set the
// length to 200 pixels and the labels on the right side.
cAxis = c.setColorAxis(660, 80, cd.TopRight, 200, cd.Right);
// Set the color axis title with 12 points Arial Bold font
cAxis.setTitle("Z Title Placeholder", "Arial Bold", 12);
// Add a bounding box with light grey (eeeeee) background and grey (888888) border. Set the top-left
// and bottom-right corners to rounded corners of 10 pixels radius.
cAxis.setBoundingBox("0xeeeeee", "0x888888");
cAxis.setRoundedCorners(10, 0, 10, 0);
// Set surface grid lines to semi-transparent black (cc000000)
c.setSurfaceAxisGrid("0xcc000000");
// Set contour lines to semi-transparent white (80ffffff)
c.setContourColor("0x80ffffff");
// Set the walls to black in color
c.setWallColor("0x000000");
// Set the xyz major wall grid lines to white (ffffff), and minor wall grid lines to grey (888888)
c.setWallGrid("0xffffff", "0xffffff", "0xffffff", "0x888888", "0x888888", "0x888888");
// Set the wall thickness to 0
c.setWallThickness(0, 0, 0);
// Show only the xy wall, and hide the yz and zx walls.
c.setWallVisibility(True, False, False);
// Set the x, y and z axis titles using 12 points Arial Bold font
c.xAxis().setTitle("X Title<*br*>Placeholder", "Arial Bold", 12);
c.yAxis().setTitle("Y Title<*br*>Placeholder", "Arial Bold", 12);
// Output the chart
chart1URL = c.makeSession(GetPageContext(), "chart1", cd.JPG);
</cfscript>
<html>
<body style="margin:5px 0px 0px 5px">
<div style="font-size:18pt; font-family:verdana; font-weight:bold">
Scattered Data Surface Chart
</div>
<hr style="border:solid 1px #000080" />
<cfoutput>
<div style="font-size:9pt; font-family:verdana; margin-bottom:1.5em">
<a href='viewsource.cfm?file=#CGI.SCRIPT_NAME#'>View Source Code</a>
</div>
<img src="getchart.cfm?#chart1URL#" />
</cfoutput>
</body>
</html> |