<cfscript>
// ChartDirector for ColdFusion API Access Point
cd = CreateObject("java", "ChartDirector.CFChart");
// A utility to allow us to create arrays with data in one line of code
function Array() {
var result = ArrayNew(1);
var i = 0;
for (i = 1; i LTE ArrayLen(arguments); i = i + 1)
result[i] = arguments[i];
return result;
}
// The data for the bar chart
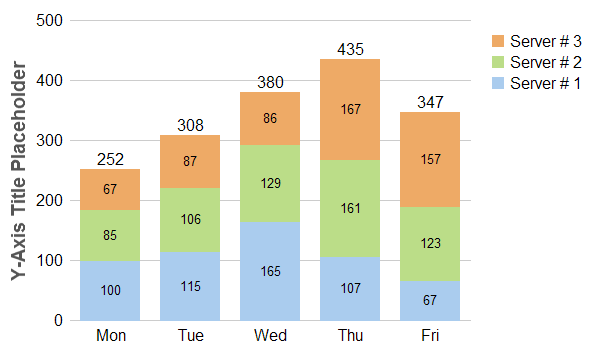
data0 = Array(100, 115, 165, 107, 67);
data1 = Array(85, 106, 129, 161, 123);
data2 = Array(67, 87, 86, 167, 157);
// The labels for the bar chart
labels = Array("Mon", "Tue", "Wed", "Thu", "Fri");
// Create a XYChart object of size 600 x 360 pixels
c = cd.XYChart(600, 360);
// Set the plotarea at (70, 20) and of size 400 x 300 pixels, with transparent background and border
// and light grey (0xcccccc) horizontal grid lines
c.setPlotArea(70, 20, 400, 300, cd.Transparent, -1, cd.Transparent, "0xcccccc");
// Add a legend box at (480, 20) using vertical layout and 12pt Arial font. Set background and
// border to transparent and key icon border to the same as the fill color.
b = c.addLegend(480, 20, True, "Arial", 12);
b.setBackground(cd.Transparent, cd.Transparent);
b.setKeyBorder(cd.SameAsMainColor);
// Set the x and y axis stems to transparent and the label font to 12pt Arial
c.xAxis().setColors(cd.Transparent);
c.yAxis().setColors(cd.Transparent);
c.xAxis().setLabelStyle("Arial", 12);
c.yAxis().setLabelStyle("Arial", 12);
// Add a stacked bar layer
layer = c.addBarLayer2(cd.Stack);
// Add the three data sets to the bar layer
layer.addDataSet(data0, "0xaaccee", "Server ## 1");
layer.addDataSet(data1, "0xbbdd88", "Server ## 2");
layer.addDataSet(data2, "0xeeaa66", "Server ## 3");
// Set the bar border to transparent
layer.setBorderColor(cd.Transparent);
// Enable labelling for the entire bar and use 12pt Arial font
layer.setAggregateLabelStyle("Arial", 12);
// Enable labelling for the bar segments and use 12pt Arial font with center alignment
layer.setDataLabelStyle("Arial", 10).setAlignment(cd.Center);
// For a vertical stacked bar with positive data, the first data set is at the bottom. For the
// legend box, by default, the first entry at the top. We can reverse the legend order to make the
// legend box consistent with the stacked bar.
layer.setLegendOrder(cd.ReverseLegend);
// Set the labels on the x axis.
c.xAxis().setLabels(labels);
// For the automatic y-axis labels, set the minimum spacing to 40 pixels.
c.yAxis().setTickDensity(40);
// Add a title to the y axis using dark grey (0x555555) 14pt Arial Bold font
c.yAxis().setTitle("Y-Axis Title Placeholder", "Arial Bold", 14, "0x555555");
// Output the chart
chart1URL = c.makeSession(GetPageContext(), "chart1");
// Include tool tip for the chart
imageMap1 = c.getHTMLImageMap("", "", "title='{dataSetName} on {xLabel}: {value} MBytes/hour'");
</cfscript>
<html>
<body style="margin:5px 0px 0px 5px">
<div style="font-size:18pt; font-family:verdana; font-weight:bold">
Stacked Bar Chart
</div>
<hr style="border:solid 1px #000080" />
<cfoutput>
<div style="font-size:9pt; font-family:verdana; margin-bottom:1.5em">
<a href='viewsource.cfm?file=#CGI.SCRIPT_NAME#'>View Source Code</a>
</div>
<img src="getchart.cfm?#chart1URL#" usemap="##map1" border="0" />
<map name="map1">#imageMap1#</map>
</cfoutput>
</body>
</html> |