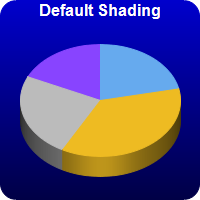
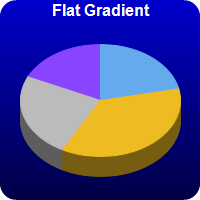
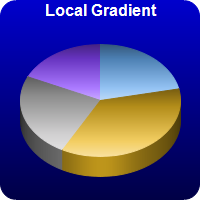
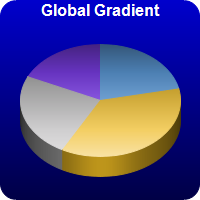
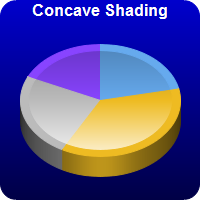
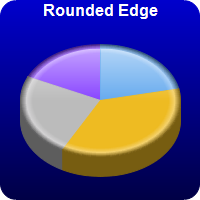
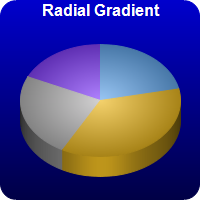
This example demonstrates various sector shading effects applicable to 3D pie charts.
ChartDirector 6.0 (ColdFusion Edition)
3D Pie Shading
Source Code Listing
<cfscript>

// ChartDirector for ColdFusion API Access Point
cd = CreateObject("java", "ChartDirector.CFChart");

// A utility to allow us to create arrays with data in one line of code
function Array() {
    var result = ArrayNew(1);
    var i = 0;
    for (i = 1; i LTE ArrayLen(arguments); i = i + 1)
        result[i] = arguments[i];
    return result;
}

// Function to create the demo charts
function createChart(chartIndex)
{
    // Declare local variables
    var data = 0;
    var labels = 0;
    var colors = 0;
    var c = 0;
    var ret = 0;

    // The data for the pie chart
    data = Array(18, 30, 20, 15);

    // The labels for the pie chart
    labels = Array("Labor", "Licenses", "Facilities", "Production");

    // The colors to use for the sectors
    colors = Array("0x66aaee", "0xeebb22", "0xbbbbbb", "0x8844ff");

    // Create a PieChart object of size 200 x 200 pixels. Use a vertical gradient color from blue
    // (0000cc) to deep blue (000044) as background. Use rounded corners of 16 pixels radius.
    c = cd.PieChart(200, 200);
    c.setBackground(c.linearGradientColor(0, 0, 0, c.getHeight(), "0x0000cc", "0x000044"));
    c.setRoundedFrame("0xffffff", 16);

    // Set the center of the pie at (100, 100) and the radius to 80 pixels
    c.setPieSize(100, 100, 80);

    // Set the pie data
    c.setData(data, labels);

    // Set the sector colors
    c.setColors2(cd.DataColor, colors);

    // Draw the pie in 3D with a pie thickness of 20 pixels
    c.set3D(20);

    // Demonstrates various shading modes
    if (chartIndex EQ 0) {
        c.addTitle("Default Shading", "bold", 12, "0xffffff");
    } else if (chartIndex EQ 1) {
        c.addTitle("Flat Gradient", "bold", 12, "0xffffff");
        c.setSectorStyle(cd.FlatShading);
    } else if (chartIndex EQ 2) {
        c.addTitle("Local Gradient", "bold", 12, "0xffffff");
        c.setSectorStyle(cd.LocalGradientShading);
    } else if (chartIndex EQ 3) {
        c.addTitle("Global Gradient", "bold", 12, "0xffffff");
        c.setSectorStyle(cd.GlobalGradientShading);
    } else if (chartIndex EQ 4) {
        c.addTitle("Concave Shading", "bold", 12, "0xffffff");
        c.setSectorStyle(cd.ConcaveShading);
    } else if (chartIndex EQ 5) {
        c.addTitle("Rounded Edge", "bold", 12, "0xffffff");
        c.setSectorStyle(cd.RoundedEdgeShading);
    } else if (chartIndex EQ 6) {
        c.addTitle("Radial Gradient", "bold", 12, "0xffffff");
        c.setSectorStyle(cd.RadialShading);
    }

    // Disable the sector labels by setting the color to Transparent
    c.setLabelStyle("", 8, cd.Transparent);

    // Output the chart
    ret = StructNew();
    ret.imageURL = c.makeSession(GetPageContext(), "chart" & chartIndex);

    // Include tool tip for the chart
    ret.imageMap = c.getHTMLImageMap("", "", "title='{label}: US${value}K ({percent}%)'");

    return ret;
}

chart0 = createChart(0);
chart1 = createChart(1);
chart2 = createChart(2);
chart3 = createChart(3);
chart4 = createChart(4);
chart5 = createChart(5);
chart6 = createChart(6);

</cfscript>
<html>
<body style="margin:5px 0px 0px 5px">
<div style="font-size:18pt; font-family:verdana; font-weight:bold">
    3D Pie Shading
</div>
<hr style="border:solid 1px #000080" />
<cfoutput>
<div style="font-size:9pt; font-family:verdana; margin-bottom:1.5em">
    <a href='viewsource.cfm?file=#CGI.SCRIPT_NAME#'>View Source Code</a>
</div>
<img src="getchart.cfm?#chart0.imageURL#" usemap="##map0" border="0" />
<map name="map0">#chart0.imageMap#</map>
<img src="getchart.cfm?#chart1.imageURL#" usemap="##map1" border="0" />
<map name="map1">#chart1.imageMap#</map>
<img src="getchart.cfm?#chart2.imageURL#" usemap="##map2" border="0" />
<map name="map2">#chart2.imageMap#</map>
<img src="getchart.cfm?#chart3.imageURL#" usemap="##map3" border="0" />
<map name="map3">#chart3.imageMap#</map>
<img src="getchart.cfm?#chart4.imageURL#" usemap="##map4" border="0" />
<map name="map4">#chart4.imageMap#</map>
<img src="getchart.cfm?#chart5.imageURL#" usemap="##map5" border="0" />
<map name="map5">#chart5.imageMap#</map>
<img src="getchart.cfm?#chart6.imageURL#" usemap="##map6" border="0" />
<map name="map6">#chart6.imageMap#</map>
</cfoutput>
</body>
</html> |