<cfscript>
// ChartDirector for ColdFusion API Access Point
cd = CreateObject("java", "ChartDirector.CFChart");
// A utility to allow us to create arrays with data in one line of code
function Array() {
var result = ArrayNew(1);
var i = 0;
for (i = 1; i LTE ArrayLen(arguments); i = i + 1)
result[i] = arguments[i];
return result;
}
// The XYZ data for the 3D scatter chart as 3 random data series
r = cd.RanSeries(3);
xData = r.getSeries2(20, 100, -10, 10);
yData = r.getSeries2(20, 100, -10, 10);
zData = r.getSeries2(20, 100, -10, 10);
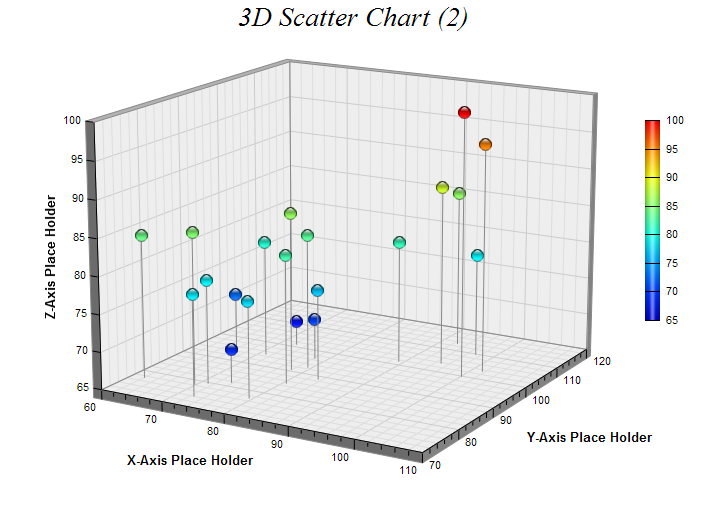
// Create a ThreeDScatterChart object of size 720 x 520 pixels
c = cd.ThreeDScatterChart(720, 520);
// Add a title to the chart using 20 points Times New Roman Italic font
c.addTitle("3D Scatter Chart (2) ", "Times New Roman Italic", 20);
// Set the center of the plot region at (350, 240), and set width x depth x height to 360 x 360 x
// 270 pixels
c.setPlotRegion(350, 240, 360, 360, 270);
// Set the elevation and rotation angles to 15 and 30 degrees
c.setViewAngle(15, 30);
// Add a scatter group to the chart using 13 pixels glass sphere symbols, in which the color depends
// on the z value of the symbol
g = c.addScatterGroup(xData, yData, zData, "", cd.GlassSphere2Shape, 13, cd.SameAsMainColor);
// Add grey (888888) drop lines to the symbols
g.setDropLine("0x888888");
// Add a color axis (the legend) in which the left center is anchored at (645, 220). Set the length
// to 200 pixels and the labels on the right side. Use smooth gradient coloring.
c.setColorAxis(645, 220, cd.Left, 200, cd.Right).setColorGradient();
// Set the x, y and z axis titles using 10 points Arial Bold font
c.xAxis().setTitle("X-Axis Place Holder", "Arial Bold", 10);
c.yAxis().setTitle("Y-Axis Place Holder", "Arial Bold", 10);
c.zAxis().setTitle("Z-Axis Place Holder", "Arial Bold", 10);
// Output the chart
chart1URL = c.makeSession(GetPageContext(), "chart1");
// Include tool tip for the chart
imageMap1 = c.getHTMLImageMap("", "", "title='(x={x|p}, y={y|p}, z={z|p}'");
</cfscript>
<html>
<body style="margin:5px 0px 0px 5px">
<div style="font-size:18pt; font-family:verdana; font-weight:bold">
3D Scatter Chart (2)
</div>
<hr style="border:solid 1px #000080" />
<cfoutput>
<div style="font-size:9pt; font-family:verdana; margin-bottom:1.5em">
<a href='viewsource.cfm?file=#CGI.SCRIPT_NAME#'>View Source Code</a>
</div>
<img src="getchart.cfm?#chart1URL#" usemap="##map1" border="0" />
<map name="map1">#imageMap1#</map>
</cfoutput>
</body>
</html> |