<cfscript>
// ChartDirector for ColdFusion API Access Point
cd = CreateObject("java", "ChartDirector.CFChart");
// A utility to allow us to create arrays with data in one line of code
function Array() {
var result = ArrayNew(1);
var i = 0;
for (i = 1; i LTE ArrayLen(arguments); i = i + 1)
result[i] = arguments[i];
return result;
}
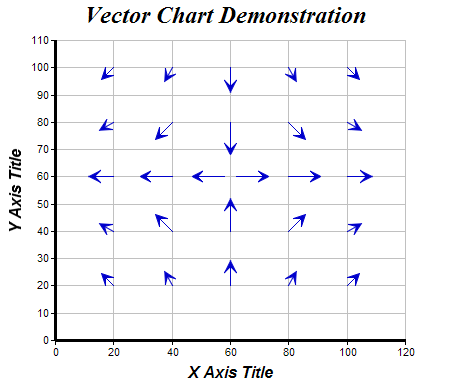
// The (x, y) coordinates of the starting point of the vectors
dataX = Array(20, 40, 60, 80, 100, 20, 40, 60, 80, 100, 20, 40, 58, 62, 80, 100, 20, 40, 60, 80,
100, 20, 40, 60, 80, 100);
dataY = Array(20, 20, 20, 20, 20, 40, 40, 40, 40, 40, 60, 60, 60, 60, 60, 60, 80, 80, 80, 80, 80,
100, 100, 100, 100, 100);
// The lengths (radii) and directions (angles) of the vectors
dataR = Array(6, 6, 9, 6, 6, 6, 9, 12, 9, 6, 9, 12, 12, 12, 12, 9, 6, 9, 12, 9, 6, 6, 6, 9, 6, 6);
dataA = Array(-45, -30, 0, 30, 45, -60, -45, 0, 45, 60, -90, -90, -90, 90, 90, 90, -120, -135, 180,
135, 120, -135, -150, 180, 150, 135);
// Create a XYChart object of size 450 x 390 pixels
c = cd.XYChart(450, 390);
// Set the plotarea at (55, 40) and of size 350 x 300 pixels, with a light grey border (0xc0c0c0).
// Turn on both horizontal and vertical grid lines with light grey color (0xc0c0c0)
c.setPlotArea(55, 40, 350, 300, -1, -1, "0xc0c0c0", "0xc0c0c0", -1);
// Add a title to the chart using 18pt Times Bold Itatic font.
c.addTitle("Vector Chart Demonstration", "Times New Roman Bold Italic", 18);
// Add a title to the y axis using 12pt Arial Bold Italic font
c.yAxis().setTitle("Y Axis Title", "Arial Bold Italic", 12);
// Add a title to the x axis using 12pt Arial Bold Italic font
c.xAxis().setTitle("X Axis Title", "Arial Bold Italic", 12);
// Set the axes line width to 3 pixels
c.xAxis().setWidth(3);
c.yAxis().setWidth(3);
// Add a vector layer to the chart using blue (0000CC) color, with vector arrow size set to 11
// pixels
c.addVectorLayer(dataX, dataY, dataR, dataA, cd.YAxisScale, "0x0000cc").setArrowHead(11);
// Output the chart
chart1URL = c.makeSession(GetPageContext(), "chart1");
// Include tool tip for the chart
imageMap1 = c.getHTMLImageMap("", "",
"title='Vector at ({x}, {value}): Length = {len}, Angle = {dir} deg'");
</cfscript>
<html>
<body style="margin:5px 0px 0px 5px">
<div style="font-size:18pt; font-family:verdana; font-weight:bold">
Vector Chart
</div>
<hr style="border:solid 1px #000080" />
<cfoutput>
<div style="font-size:9pt; font-family:verdana; margin-bottom:1.5em">
<a href='viewsource.cfm?file=#CGI.SCRIPT_NAME#'>View Source Code</a>
</div>
<img src="getchart.cfm?#chart1URL#" usemap="##map1" border="0" />
<map name="map1">#imageMap1#</map>
</cfoutput>
</body>
</html> |